About mariwt
View all posts by mariwt
«The man on the street»
What do the man on the street know about global warming and what kind of arguments do the scientist give us about this subject? This is in short terms what I want to discuss in this paper. First I want to present some of the evidence scientist use when they discuss global warming and the human impact. Then I will present some of the counter arguments skeptics’ use against the knowledge presented.
How much do people know about global warming? This is not an easy question to answer, and the answer will probably differ a lot from person to person. One thing a lot of people have in common is that they all care about the weather! Already in 2015, Norway has had some of the most extreme storms and temperature variability’s people have ever experienced, and it is only February. The sad thing is that storms and unstable weather are becoming more frequent all over the globe. How often don’t we hear about storm, hurricanes, droughts and flood in the news? One way to explain this is; the globe is changing! But what is changing?
The first and most obvious argument is the globe is getting warmer, global warming. This is often the first thing people mention when they are to discuss global warming. It is documented that the temperature has increased, and the scientists have evidence to support this observation. Since the 1850 the average temperature has increased by 0.85 degrees Celsius (IPCC Fifth Assessment Report: CSIROexperts comment. (2013)). In IPCC Fifth Assessment Report they present two main findings: 1) There is no doubt that Earth is warming. 2) It is extremely likely that more than half of warming over the last 60 years is due to human influence. The extreme likely is used in this report for the first time in 2013. They have over a series of years followed the development and they have now high confidence to believe it is due to human impact.
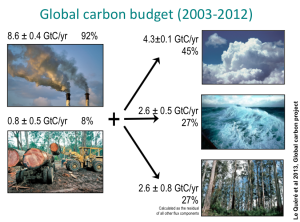
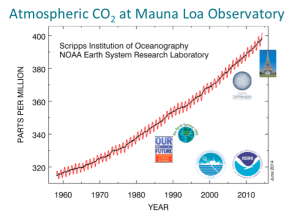
One example comes from Hawaii. In Hawaii, atmospheric CO2 have been measured since the 1960s. What we can see from the graph below this section is that the amount of CO2 in the atmosphere has grown from 320ppm(parts per million) in 1960 to 400ppm today. This isn’t just a linear increase, but an exponential increase, and that is devastating news. The net uptake of CO2 in the ocean and in the forests is 27% respectively. The remaining 45% goes into the atmosphere. This basically comes from fossil fuels and deforestation in the rainforest. That is almost 1000 tons per second! (Tore Furevik, the Centre for Climate Research University of Bergen).

Figure.1: The figure shows the global carbon budget. (from the lecture notes by Tore Furevik).

Figure.2: The figure shows the linear increase of CO2 in the atmosphere, taken in Hawaii (from the lecture notes by Tore Furevik).
How can the “man on the street” notice this increase in ppm (parts per million)? The “man on the street” cannot notice the parts per million, but they can notice the increase in temperature. Temperature rise is the result of what I have presented here with the increase in ppt, and that is what people experience physically. The people who are sceptic towards global warming may not trust the collecting data of these observations. In regard to the temperature increase, they argue and believe the records of the temperatures are unreliable and that they exaggerate the amount of warming due to the “urban heat island” effect. With the Urban heat Island they think about the location of record stations. The measurements are often taken at ground levels, in cities and towns(Totty, 2006). It is true that the stations are on Earth level, but the results presented are collected from all over the planet and converted into one statistic. The fact that the increase in temperature high up in the atmosphere is not significantly bigger does not change the overall trends that indicate global warming(Totty, 2006).
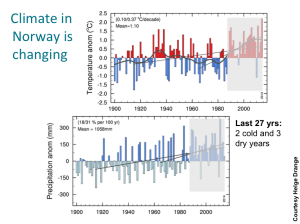
Other evidence people in the north can relate to in understanding and accepting global warming is the amount of precipitation we experience in a year, month or even a week in the most extreme areas. It is actually here in the Northern Hemisphere we find the biggest changes in temperature and precipitation. This is due to the fact that we have a lot more continents in the north. With the large, dark areas now being exposed due to the melting of glaciers and ice coverage, the continents have a larger impact than what the ocean have. The following graph displays the measurements taken in the last decade of temperature and precipitation. In IPCC Fifth Assessment Report (2013) they present the observations of temperature change and precipitation change with high confidence. Again, sceptics can argue that natural factors can be enough to account for this modern warming from the 1900th. Scientists can relate to the fact that solar energy and natural changes can have quite an impact on the world’s climate. But then again, the natural factors aren’t enough to account for the sharp increase in temperatures and precipitation since the late 1970 as we see here (Totty, 2006).

Figure.3: The two graphs show how the annual amounts of precipitation and temperature in Norway have changes since 1900. (from the lecture notes by Tore Furevik).
One of the biggest challenges climate change has today is the amount of CO2 emission from the industry. We can discuss what to do with this forever. Scientists can present evidence, but they can just do so much. In the end, it is the politicians that have to find some common ground to develop strategies that can save the planet. Lets hope they find this in The United Nations Climate Change Conference in Paris this year.
References
CLIMATE CHANGE 2014, Synthesis Report, Summary for Policymakers. IPCC Fifth Assessment Report: CSIROexperts comment. (2013). ECOS.
TOTTY, M. 2006. What Global Warming. The Wall Street Journal, 6. December 2009[Internett] Tilgjengelig fra: <http://www.wsj.com/articles/SB10001424052748703819904574551303527570212>[Lest 6.februar 2015]
Lecture notes from Professor Tore Furevik Bjerknes from the Centre for Climate Research University of Bergen