Month: mars 2015
Differing perceptions on conserving nature
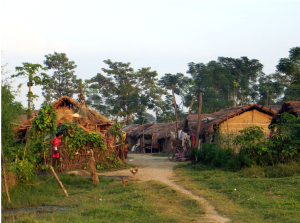
A Tharu village in the buffer zone of Chitwan National Park, Nepal. (photo: Ben Robson)
The natural world has constantly changed and developed as a result of both natural and anthropogenic influences over geological time [1], the notion of conserving and preserving landscapes for future generations is however relatively recent. In particular, a distinction exists between perceptions of how “pristine” landscapes should be conserved between the more developed “Northern” countries and the less developed nations in the “South.”
Countries in the North generally moved from a predominantly rural population to a more urbanised population during the industrial revolution, as such when national parks and conservations were established in the mid-20th century, significant populations were already settled within the new national park boundaries, thereby limiting the amount of conservation that could be carried out. National parks in Western Europe generally conform to a grade V classification according to the IUCN classification scheme (table 1), aiming to find a compromise between the needs of both mankind and nature.
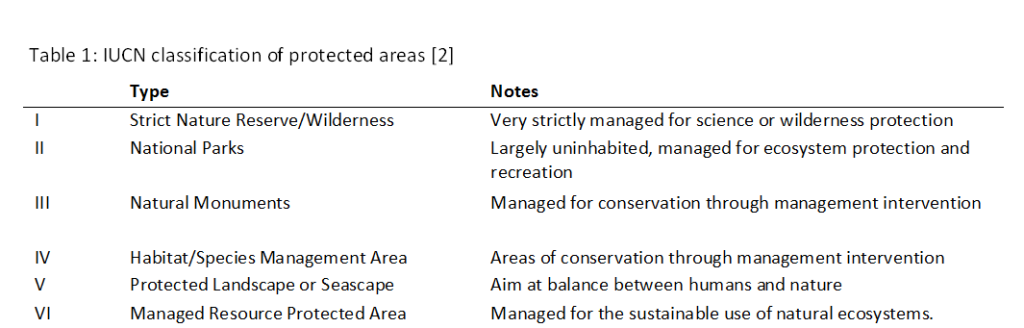
75% of land within English and Welsh national parks is privately owned meaning it is seldom that pure «wilderness» is found. Activities such as farming, mineral extraction or power generation are in some cases permitted within the park, but economic activity that that could aesthetically impact the landscapes that we associate with our cultural or national identity are limited [2]. and steps are taken to preserve the building style, land-use and character of the area. For example, many would associate the Lake District National Park with William Wordsworth, traditional rustic farming, the rolling hills of England and relaxing around the lakes than they would with untouched nature. It could be argued that most British, and to an extent European national parks are therefore preserving a human-influenced landscape that we feel is in danger rather than a wilderness. Economics can be one of the biggest driving factors in establishing new parks, revenue from tourism has helped create parks in Australia, the UK and Canada during the last 20 years[2].

The Lake District, UK, has been a popular destination long before it was designated a national park in 1951. William Wordsworth famously wrote «I Wandered Lonely as a Cloud» about the area in 1802 (photo: wikipedia)
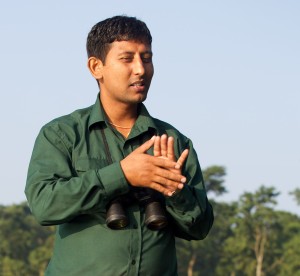
Our Tharu guide, Raju, had his father killed by a wild elephant. (Photo: Pål Ringkjøb Nielsen)
National parks in developing countries on the other hand were often established after those in industrialised nations and while a higher proportion of the population lived rurally. Some communities therefore underwent challenges to their livelihoods, or in some cases were forcibly evicted in favour of conservation [3]. Following the establishment of the Chitwan National Park in Nepal, the Tharu people faced restrictions on the amount of biomass and fruit that could be harvested, while fishing, hunting, and the amount of grazing land were also restricted [4]. Since 1964 over 22,000 Tharu have been removed from the park. Despite initial high expectations, many Tharu found the compensatory land was inadequate in terms of soil quality, resources, location and cultural value. Additionally, the re-location has affected the community social structure by mixing indigenous and hill castes [4]. The fate of the Tharu people is just one of many examples of local people being marginalised in favour of conservation, where following resettlement the population are forced to become less self-sufficient without the natural resources they previously relied upon.
It’s not just the understanding of national parks that differ between the “North” and “South” when it comes to how conservation is perceived. There is also a large distinction on how the conservation of large mammals. Despite a population of just 35 to 52 wolves, Norway kills over 25% of the population each year, and also permits the cull of bears, wolverines and even Golden eagles that have killed reindeer [5]. The wolves are exterminated based on the risk posed to farmers and their livestock. In reality however no one has been killed by a wolf in Norway since 1800 and of the 26,512 cases where farmers were richly compensated for livestock killed by wolves in 2012, only 1809 (7%) cases presented carcasses. A further 20,000 cases were rejected by the authorities [6].
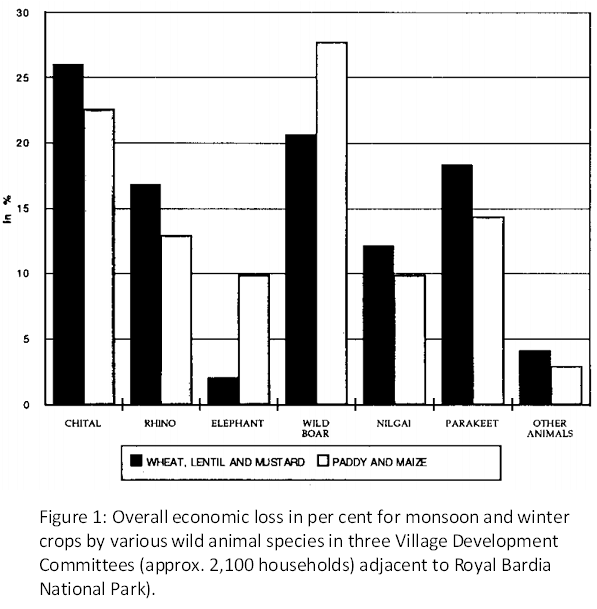
That one of the world’s richest countries can kill a “critically endangered” species seems contradictory when you consider how Norway is an avid supporter of conservation in the developing world. Human-wildlife interactions are a serious problem in Nepal where 21 people were killed by wild elephants between 2008 and 2012 [7] while crops such as rice, lentils and wheat are frequently damaged by wild animals [8]. Some have argued that if less developed countries were to use similar tactics for protecting their agricultural livelihoods there would be widespread commendation [6].
Of course, the Scandinavian countries do many great things for conservation both at home and abroad, but I think that if conservation of nature is to be addressed on a global scale then we need a global consensus of how to construe conservation. We need to decide what landscapes we are conserving and whether they should be conserved due to their importance for wildlife and nature or due to their cultural value to us and whether there should be a distinction in conservation techniques between landscapes. Similarly we cannot expect poorer nations to act on our public perception and advice concerning conserving of large mammals when we take such drastic action on curtailing animals perceived to be a threat within our own territory.
- Hannah, L., et al., Conservation of biodiversity in a changing climate. Conservation Biology, 2002. 16(1): p. 264-268.
- Woods, M., Rural geography: Processes, responses and experiences in rural restructuring. 2004: Sage.
- Brockington, D. and J. Igoe, Eviction for conservation: A global overview. Conservation and society, 2006. 4(3): p. 424.
- McLean, J. and S. Straede, Conservation, relocation, and the paradigms of park and people management – A case study of Padampur Villages and the Royal Chitwan National Park, Nepal. Society & Natural Resources, 2003. 16(6): p. 509-526.
- Monibot, G., Norway’s plan to kill wolves explodes myth of environmental virtue, in The Guardian. 2012: London.
- McPherson, B., Den norske ulveløgnen, in Aftenposten. 2013: Oslo.
- Pant, G. and M. Hockings, Understanding the Nature and Extent of Human-Elephant Conflict in Central Nepal. 2013.
- Studsrød, J.E. and P. Wegge, Park-people relationships: the case of damage caused by park animals around the Royal Bardia National Park, Nepal. Environmental conservation, 1995. 22(02): p. 133-142.
Out of sight, out of mind? Ecological change in the oceans
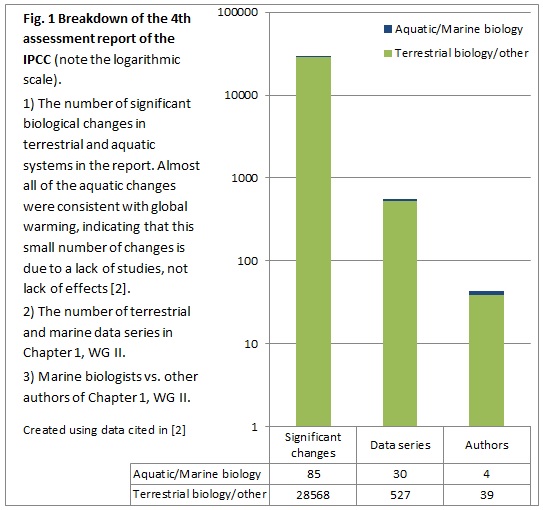
The oceans are greatly impacted by anthropogenic inputs, but are under-sampled. Despite indications that marine species appear to be responding as or more rapidly to global change than terrestrial species [1], only 11% of studies in the fields of ecology, conservation biology and biodiversity (1996-2004) concerned marine systems, and this is evident in large syntheses such as IPCC reports (Fig. 1; [2]). Well-known and widespread drivers of ocean change are overfishing, acidification, nutrient pollution and global warming, but there are many others [3] which receive less attention. These could lead to rapid ecosystem change, altering the provision of services we depend on such as food, water purification, or habitat for fished animals.
We understand ecological change in some marine systems fairly well. For example, kelp forests provide habitat for many seaweeds and animals, but can abruptly change into ‘barrens’ – mostly bare rock. Overfishing is an important driver – once it reaches a certain level, predators (such as cod or lobsters) become too rare and the urchin population explodes, eating all the kelp and preventing regrowth ([4]; and see this great video clip from the BBC). Coral reefs are another system where we have some understanding of large changes; once ocean acidification reaches a certain point calcification rates of corals will drop rapidly, as will coral survival at around 2 °C warming (see [3] for a summary). If this is combined with overfishing of herbivorous fish and nutrient pollution, a shift from coral to seaweed dominance is likely (e.g. in Florida [5]).
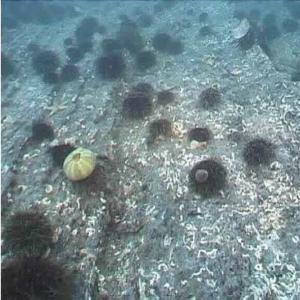
Kelp barrens dominated by urchins. Photo: NIVA (http://www.niva.no)
However, much is left to be understood even about well-known systems as we are still not sure how drivers will interact. In some cases, high pressure from one increases the impact of another, but in others, they may resist each other. For example, warming contributes to kelp forest recovery in Norway – the urchins here can only reproduce at cool temperatures, preventing warm forests from being grazed. However, in other areas, climate change negatively affects kelp forests by putting thermal stress on the kelp [6], or allowing warm-adapted urchins to expand their range [4].

Deep-sea sponges and anemones filmed from remote operated vehicles. Photos from the Centre for Geobiology, University of Bergen, Norway (http://www.uib.no/en/geobio)
We are much more in the dark about other ecosystems. The deep sea is still vastly under-sampled – we know little about what is there in the first place, let alone how it may be changing. But what we do know is that it is not the species-poor, barren landscape that it was once imagined to be. For example, there are rich faunas around hydrothermal vents which may be impacted as seabed mining becomes a reality [7,8]. Evaluation of endangered species by the IUCN also reflects lack of marine knowledge – only 9.8% of species on the red list are marine, with many species listed as ‘data deficient’ because it is difficult to get the required level of data for assessment [9]. This is a problem with terrestrial species too, but to a lesser degree than marine species – the result of this is that the extinction rate appears lower than it should be for the oceans [10], which can have effects on conservation priorities.
Some little-understood marine threats also have potentially large consequences. For example, we are aware that there is huge plastic pollution in the oceans but 99% of it is unaccounted for – we just don’t know where it is. There is a possibility that it could be accumulating biologically [11], which could have other serious knock-on effects. Chemical pollution such as PCBs can stick to plastics, thus enter the food chain more easily. PCBs themselves may be related to mass mortality events of fish or marine mammals, by increasing their susceptibility to infectious disease [12].
Conservation of the unknown
Some reasons for the lack of knowledge are practical difficulties in getting observations, poor sampling, lack of funding, and the gap between marine and terrestrial ecology [2]. These issues will have to be tackled if specific, knowledge-based conservation strategies are desired. This is possible already in some well-studied systems, where processes are sufficiently understood to allow ecosystem services-based approaches to management [e.g. 13]. For other systems, good goals could be to get knowledge to a level where we can improve the red-list for marine species, and estimate thresholds of human impacts under which ecosystems are ‘safe’. These have the advantage that they give limits and categories, which are easily communicable to policy-makers. Ways of doing this with little data may have to be developed; for example, assessing which species are threatened based on human impacts and species distribution rather than detailed, hard to get knowledge about numbers [9]. The precautionary principle can also be used – limitation of an activity because it is suspected to cause harm – but in a world where resources are limited and there is money to be made from using the environment, this can be hard to justify without enough facts.
Caroline S. Armitage
References
[1] Poloczanska ES, Brown CJ, Sydeman WJ, Kiessling W, Schoeman DS, et al. (2013) Global imprint of climate change on marine life. Nature Clim Change 3:919-925
[2] Richardson AJ, Poloczanska ES (2008) Under-Resourced, Under Threat. Science 320:1294-1295
[3] Duarte CM (2014) Global Change and the Future Ocean: A Grand Challenge for Marine Sciences. Frontiers in Marine Science 1:1-16
[4] Ling SD, Johnson CR, Frusher SD, Ridgway KR (2009) Overfishing reduces resilience of kelp beds to climate-driven catastrophic phase shift. Proceedings of the National Academy of Sciences 106:22341-22345
[5] Trivedi, B.P. (2001) Why is seaweed killing Florida’s coral reefs? National Geographic News: http://news.nationalgeographic.com/news/2001/08/0823_TVseaweed.html [Accessed 10.02.2015]
[6] Rinde E, Christie H, Fagerli CW, Bekkby T, Gundersen H, et al. (2014) The influence of physical factors on kelp and sea urchin distribution in previously and still grazed areas in the NE Atlantic. PLoS ONE 9(6) DOI: 10.1371/journal.pone.0100222
[7] Moskvitch, K. (2014) Health check for deep-sea mining. Nature 512(7513).
[8] Shukman, D. (2014) Deep sea mining licences issued. BBC News: http://www.bbc.com/news/science-environment-28442640
[9] Peters H, O’Leary BC, Hawkins JP, Roberts CM (2015) Identifying species at extinction risk using global models of anthropogenic impact. Global Change Biol 21:618-628
[10] Webb, T. and Mindel, B.L. (2014) Global patterns of extinction risk in marine and non-marine systems. Current Biology 25:1-6.
[11] Chen, A. (2014) Ninety-nine percent of the ocean’s plastic is missing. Science magazine, June 2014: http://news.sciencemag.org/environment/2014/06/ninety-nine-percent-oceans-plastic-missing [Accessed:09.02.2015]
[12] Handoh, I.C., Kawai,T. (2014) Modelling exposure of oceanic higher trophic-level consumers to polychlorinated biphenyls: Pollution ‘hotspots’ in relation to mass mortality events of marine mammals. Marine Pollution Bulletin 85(2):824-830
[13] Rogers A, Harborne AR, Brown CJ, Bozec Y-M, Castro C, et al. (2015) Anticipative management for coral reef ecosystem services in the 21st century. Global Change Biol 21:504-514
Domesticated ecosystems and their tradeoffs
Nowadays in the greater part of Europe food is something trivial, something omnipresent, something you don’t waste time to think about it’s origin. You just buy it in the supermarket and then you eat it. That’s it. Of course people are thinking and talking about food all the time, but if we are honest, it is more about, what we want to eat and what we should eat in order to maintain or gain our dream body. I can’t remember the last time, I had a conversation with a friend about how this trivial thing „food“ is produced, or even more: Which consequences could it entail to domesticate and tame not only crops and animals in order to gain food, but to domesticate whole landscapes in order to increase food production? And furthermore, what tradeoffs are we willing or not willing to accept in order to satisfy our everlasting desire for what we are used to: food at any given time and in any amount.
The fact alone that around 24% of the Earth’s terrestrial surface is occupied by cultivated systems, in order to satisfy the increasing demand for food, feed and fibre(1), makes it quite clear that the question of foodproduction is a very important one, when it comes to man-made landscape change. Therefore I decided to discuss some major points of the article „Domesticated Nature: Shaping Landscapes and Ecosystems for Human Welfare“ by Peter Kareiva et al.(2) in my blog.
In order to see the topic of domestication and land-use in general a bit more in context, I had a closer look on the planetary boundaries. In figure 1 you can see an illustration for the planetary boundaries, which are showing the risks of destabilizing the Earth system, as we know it in the Holocene, at a planetary scale. (3) As you can see Land-system change is one of the areas, that already have reached the zone of increasing risk, which means, that it has exceeded the boundary. Moreover, the area of Biochemical flows, which is by fertilization closely related to intensive cultivation of crops, is already in the high risk zone. Especially the nitrogen cycle is strongly out of balance.
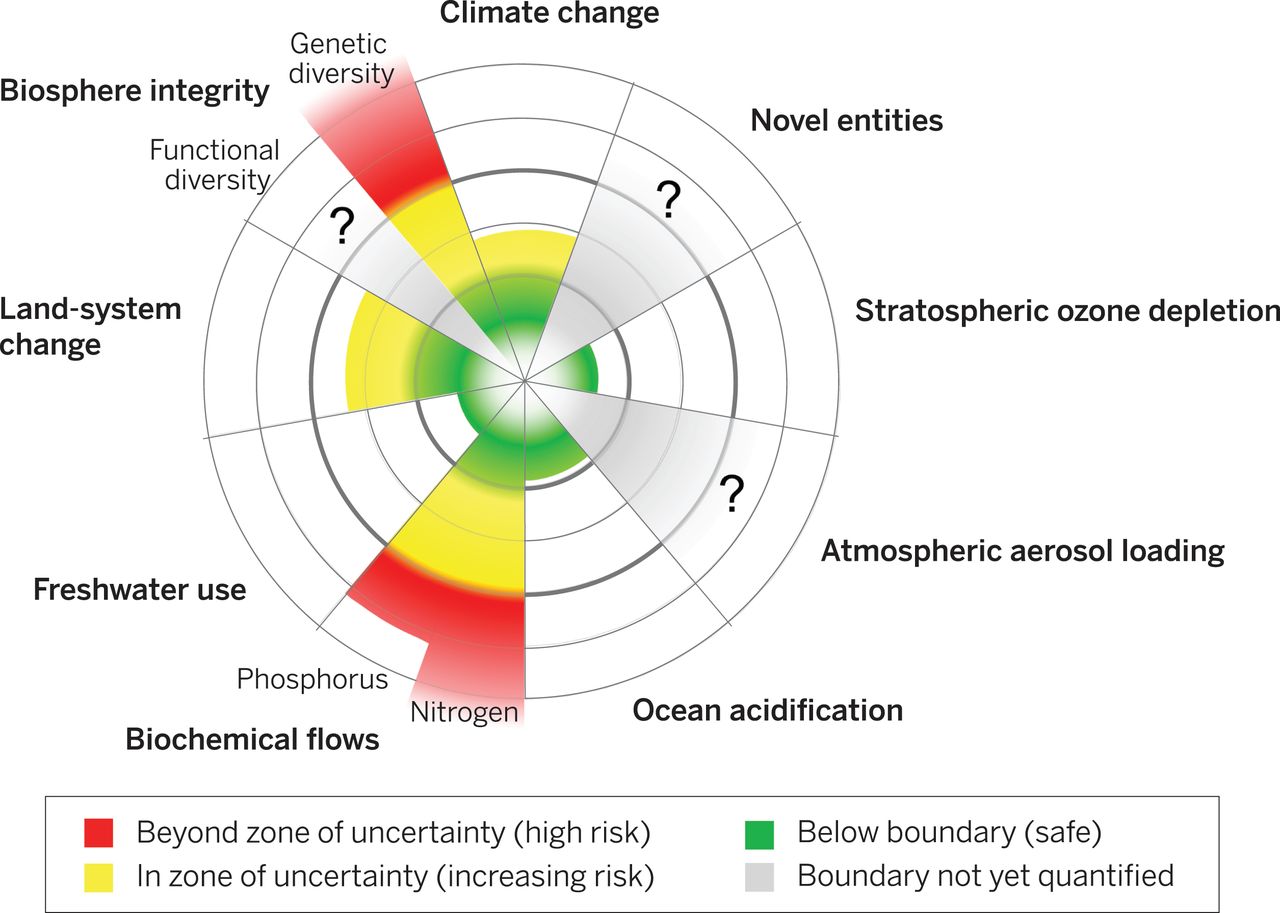
Figure 1: Shows the exceeded and not exceed boundaries of the earth system. picture from: see (3) (http://www.sciencemag.org/content/347/6223/1259855.full)
Nevertheless, the reasons why humans are domesticating landscapes are easy to understand: The three main goals of domestication are increased overall productivity, promoted commerce and protection from predators and nature events, as for example storms.(2) If you only consider these three aims, then domestication is significantly enhancing the well-being of humans. But we must not forget, that there is a known price we pay for these benefits and what is perhaps even more important, that there could be so far undiscovered risks. Therefore it is most crucial to go on researching in this field, so that the tradeoffs in ecosystem services can be better understood. This is the only way I see to decide, what is a desirable management of these tradeoffs, not only for now, but also with regard to future generations.
In order to illustrate, what is meant by tradeoffs, I have chosen one example mentioned in the article for each of the three aims. The first example has the aim to maximize productivity. As mentioned before the nitrogen cycle has been strongly damaged in order to reach an increase of food production. The massive use of fertilizers in agroecosystems leads to water pollution and as a consequence to destroyed coastal zones and algal blooms (2). An example for the impacts and tradeoffs, resulting from our pursuit of promoted commerce, is the rapid spread of deseases and invasive species, indebted by the enhanced trade. (2) The third and last example is an example for the aim to avoid risks: By the removal of top carnivores, the danger for hikers, farmers and ranchers to get attacked is decreasing. But on the other hand missing predators, can lead to an enormous increase of herbivore populations, which can cause overgrazed landscapes and other damages to the ecosystem.(2) At least after these examples we can see, that the idea of tradeoffs in ecosystem services is not only crucial but also quite complex, what makes it most likely, that there are still tons of unknown consequences of domestication.
In the debate about what the best form of stewardship for the nature is, the first idea probably most people have in mind, is the conservation of wild and pristine nature.
But because of the fact, that today only 1% of the Earth’s terrestrial surface is set aside as real wilderness (4), this is quite utopian. Moreover, I think that this idea also neglects that humans will always do, what benefits them the most. Basic human needs, like food, will always be rated higher than other desirable matters.
For me that means, that we need to spend more money on research of tradeoffs and that we need to do a greater affort to understand how the ecosystems, that we are shaping, are working. This can give us better awareness of how our decisions are influecing not only the ecosystems by themselves, but also the current and prospective well-being of humankind. This personal opinion of mine fits well together with the conclusion of Kareiva et al., that an understanding of tradeoffs made in ecosystem services is important, in order to do the step away from only trying to protect nature from human influences, towards a well-conceived management of tradeoffs among ecosystem services, from which humans and nature can simultaneously thrive. (2)
By: Bianka Mertins
References:
(1) Millennium Ecosystem Assessment, Ecosystems and Human Well-Being: Current State and Trends, Chapter 26, Island Press, 2005: http://www.unep.org/maweb/documents/document.295.aspx.pdf (accessed: 16.02.2015).
(2) Kareiva, P., et al., Domesticated Nature: Shaping Landscapes and Ecosystems for Human Welfare, Science, 2007.
(3) Steffen, W.,Planetary boundaries: Guiding human development on a changing planet, Science, 2015: http://www.sciencemag.org/content/347/6223/1259855.full (accessed:16.02.2015).
(4) UCN,World Database on Protected Areas(IUCN, Washington, DC), 2007.
Extinction debt – Do current red lists highly underestimate extinction risks?
Plants growing on high mountains are often expected to be among the first losers of the global change. When a species’ habitat changes critically the species has three options: migrate, adapt or die. Parallel with the temperature increase of the last decades, we have seen plant species migrating upwards towards colder habitats. But for high-alpine species migration is not an option as they are already sitting at the last stops – on the highest peaks. However, even after decades of climate change there have been surprisingly little extinctions. Fast adaptation maybe? No, unfortunately part of these species is already using overtime. I say overtime because their extinctions are only delayed after the disturbance, in this case climate change and increased competition (1). Extinction debt is what we call the sum of all the species with delayed extinctions (1).
Scientists modelling future distributions for alpine plant species have found out that a species might remain in its old habitat even 50 years after the habitat has changed unsuitable for the species (2). This tendency towards high delay in extinctions in high-alpine regions is mainly due to longevity of these species. Even if new plant individuals are not able to survive anymore because the habitat has gone through too much change, the old individual may remain after decades. But to be able to remain in the old habitat in the long run, the species would also need to adapt to the new environment, and for alpine specialists with long life cycles this seems very unlike.

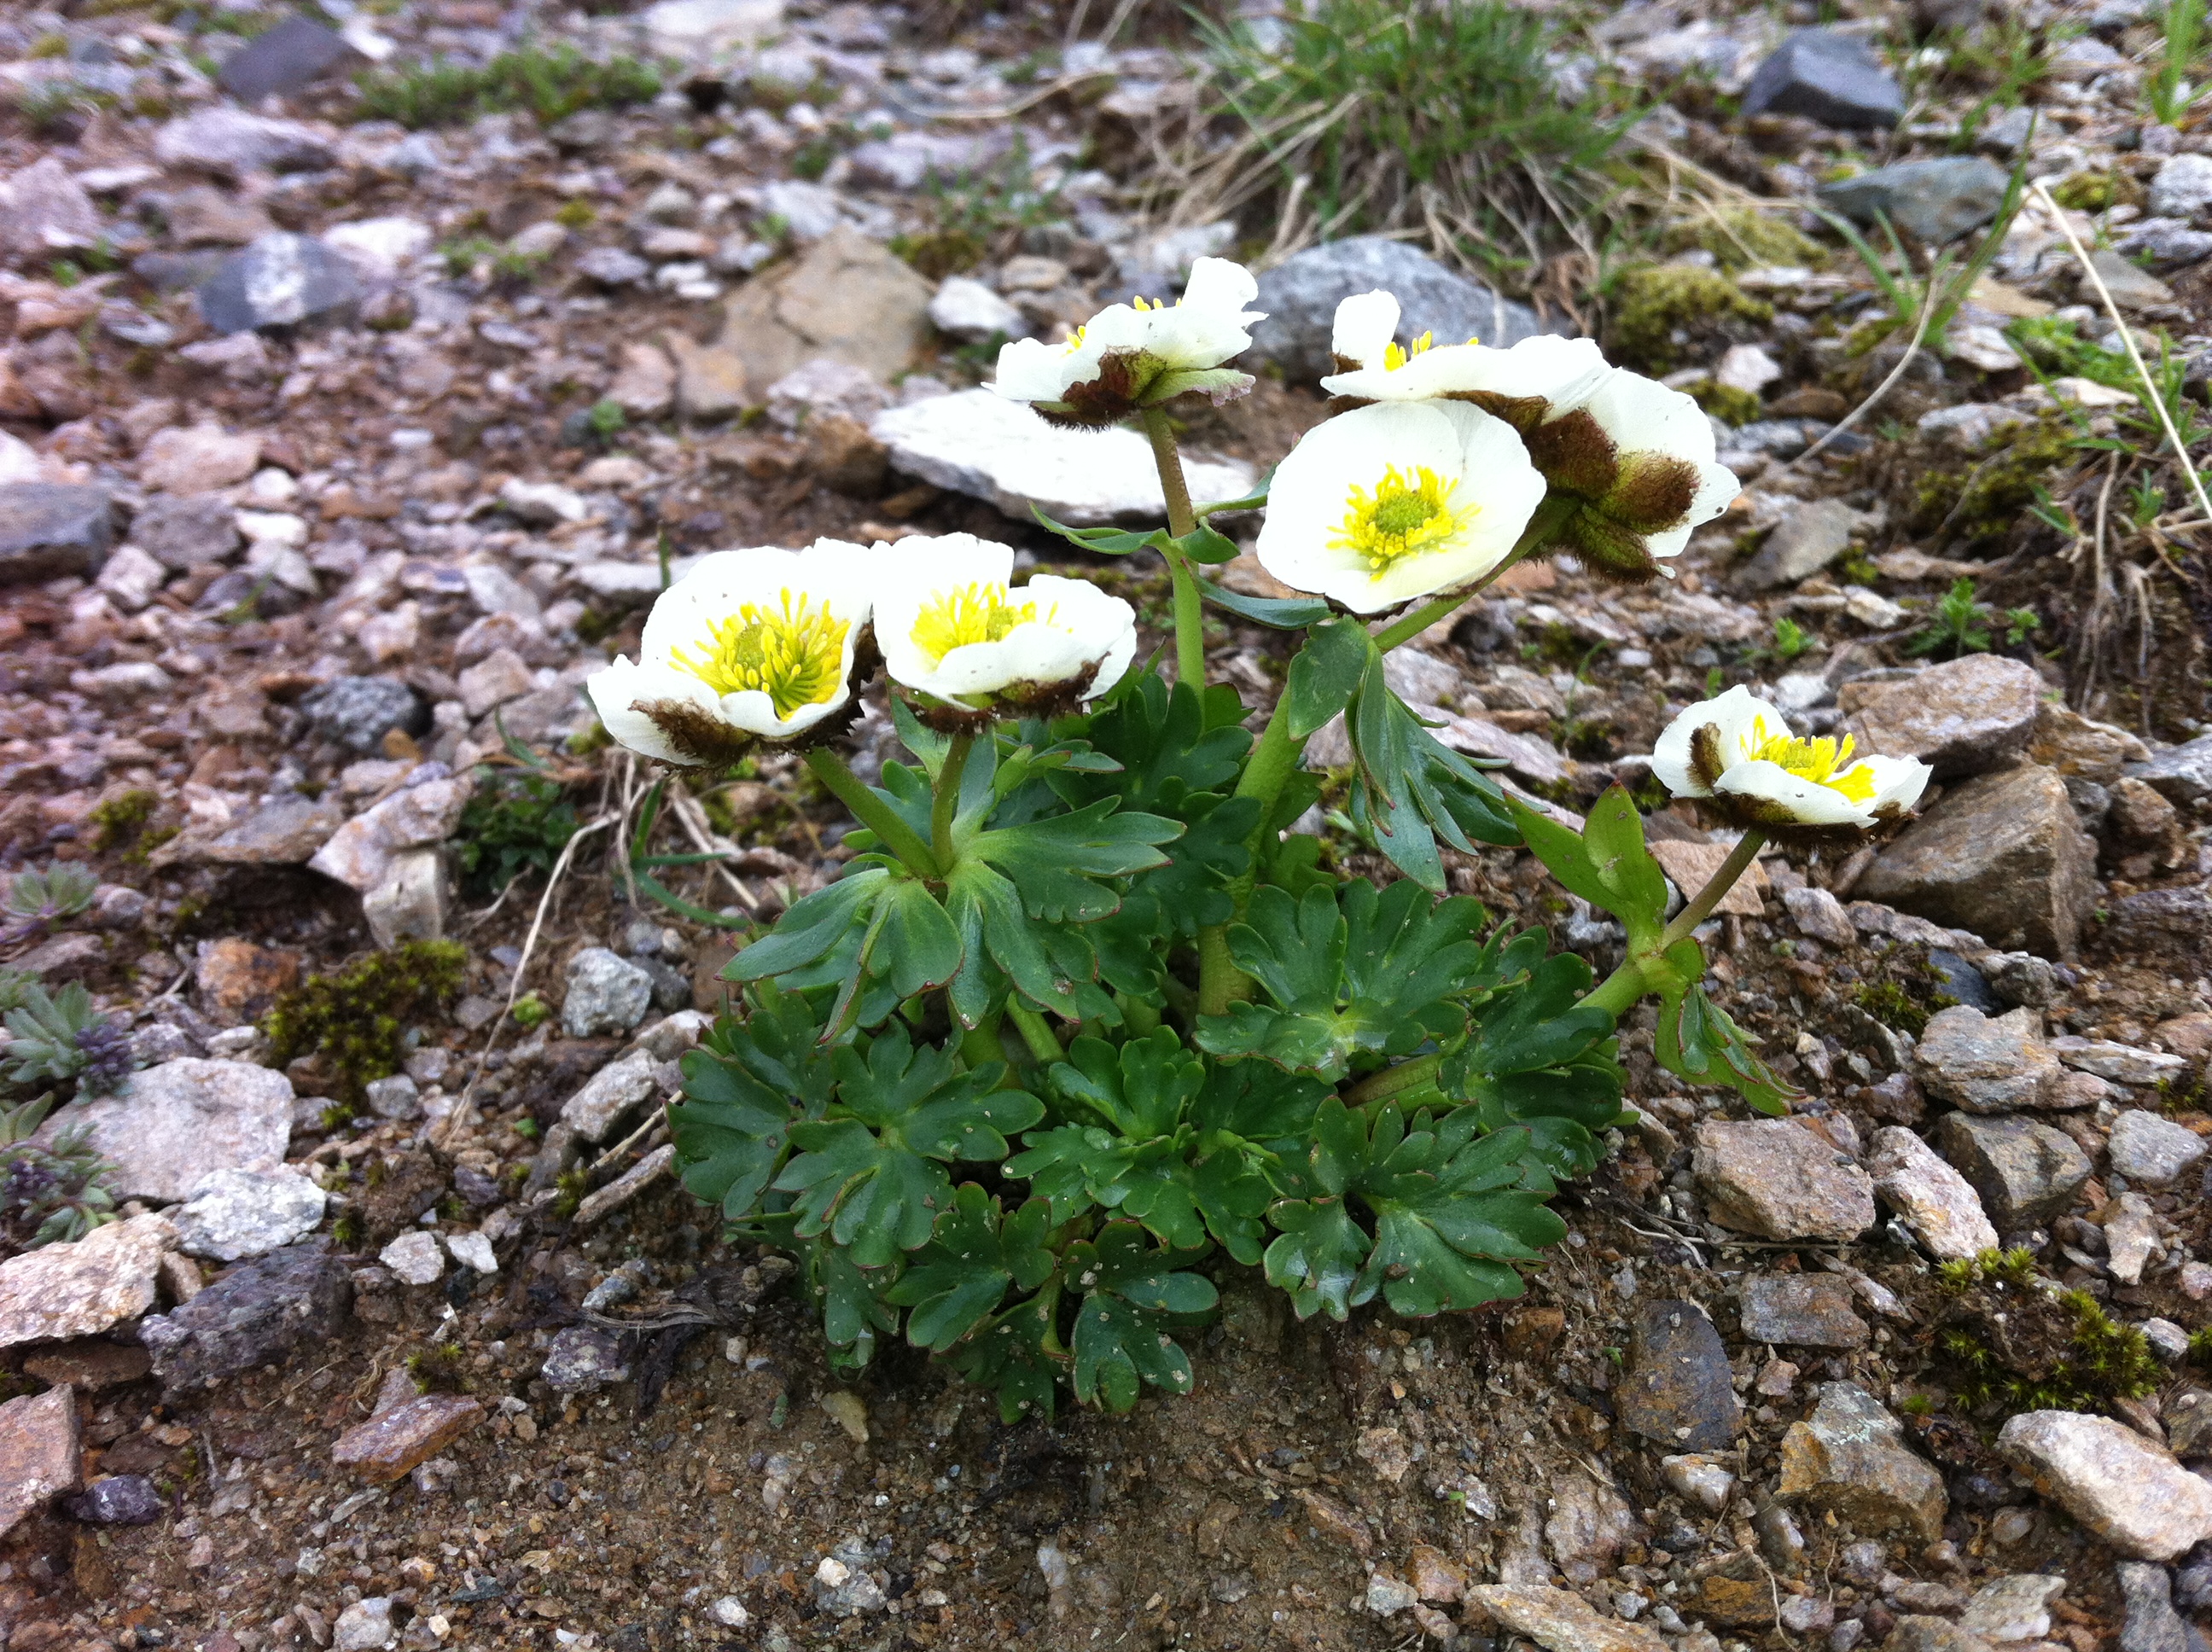
Figure 1. Left: Chummer Schwarzhorn, a mountain top in South-Eastern Swiss Alps. Right: Glacier buttercup, a typical high alpine species feared to go extinct, growing on the same mountain. Pictures by Aino Kulonen.
Mountain tops are of great interest because changes in diversity have been fast and well reported, but after all, they represent an extreme environment, covering only a small part of earth land area and small part of total biodiversity. Indeed, we should be even more scared of underestimating the extinction risk and losing essential parts of our biodiversity everywhere. Recently it has been shown how entire Europe is carrying a heavy extinction debt on its shoulders (3). And now we are not only talking about some pretty flowers whose beauty mainly mountaineers would be able to enjoy, but hundreds of species including mammals, reptiles, insects and plants.
A practical way to investigate regional extinction risk is to look at red list species. Red lists contain species that are announced to be endangered in national level. In a recent study national proportions of endangered species were compared with the pressure these countries have put on their ecosystems in years 1900, 1950 and 2000 (3). This pressure was measured as socioeconomic activity; population density, per capita GDP and intensity of land use (Fig 2). The result is alarming: for most taxonomic groups current numbers of endangered species are mirroring the pressure for ecosystem from 1900 and 1950. This means that today’s endangeredness and extinctions are results from the damage done by human already a century ago. The extinction risks we measure today are lagging 50-100 years behind human activities.
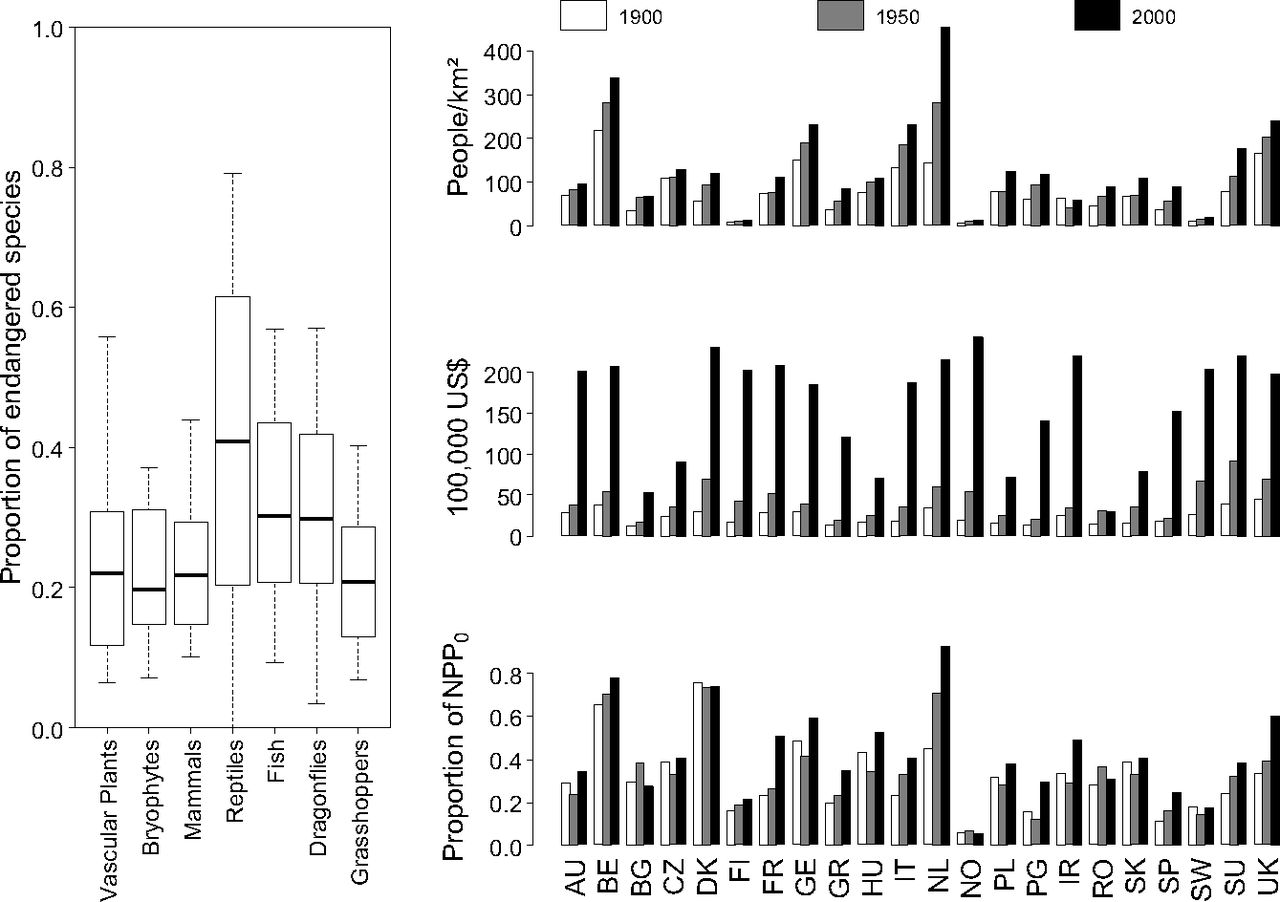
Figure 2.Left: Proportions of species facing medium-to-high extinction risks in national red lists in 22 European countries. Right: Trends in three socioeconomic indicators in Europe (human population density in people per square kilometer; per capita GDP in 100,000 International Geary–Khamis dollars; and human appropriation of net primary productivity, which is defined here as the proportion of the total net primary productivity harvested by humans to the net primary productivity of the potential vegetation (NPP0). Figure from reference 3.
The delay in extinction risk is longest for vascular plants, bryophytes, dragonflies and grasshoppers. For long living plants, long lag is not a surprise but one would think that short living insects would correspond to habitat change faster. However, simulations have shown that insect populations could show a delay of over a century even when their habitat network has been reduced close to the extinction threshold. This might be the case in Europe where agricultural landscape is a matrix of intensively used land area and near-natural habitats. Proportions of endangered fish species are the only ones that mirror best the current pressures to the ecosystem. Fish populations might indeed suffer most directly from anthropogenic actions like water pollution and management of water systems. Proportions of endangered mammals correspond well to both 1900 and 1950’s socioeconomic activity. Shorter delay is explained by their bigger habitat sizes. Fragmentation and degradation of big habitats make species meet their extinction thresholds faster than by species with small habitats.
As the pressure for ecosystems has steadily increased after 1900, we are carrying an extinction legacy that might be massive and almost impossible to measure. The study presented here is based on direct human activities, habitat fragmentation and environmental degradation like pollution (3). Novel pressures for environment like climate change, nitrogen and acidic depositions together with invasions of new species are likely to interact with direct effects and even intensify environmental degradation. With all these different direct and indirect drivers, long lag-times blur the picture and makes it harder and harder to see what is actually causing the extinction of certain species. We might easily target completely wrong drivers with our actions.
Red lists in national and global level might be way too optimistic, because they use criteria like size and recent reduction in population and range (3). Even if the current state of a species seems fine to us, the species might be doomed to extinction already decades or even a century ago. And once we notice that something’s wrong, our attempts to improve the situation might come decades too late (3).
Good news is that once we have a broader perception of the extinction debt, it will be easier to direct conservation efforts to regions and species groups with the greatest debt. As long as a species exists there is hope to save it by habitat restoration and landscape management (1). But if the driver of extinction on mountain tops really is climate change, it is harder to act directly and fast enough to save these vulnerable species. Just like shrinking glaciers, endangered mountain plants seem to work as a touchable proof of global change, but how will we save them? Are botanical gardens our only hope to save samples of these species from increasing temperatures and competition?
by Aino Kulonen
References
- Kuusisaari et al. (2009). Extinction debt: a challenge for biodiversity conservation. Trends in Ecology and Evolution 24: 10, 564-571.
- Dullinger et al. (2012). Extinction debt of high mountain plants under twenty-first-century climate change. Nature Climate Change 2, 619-622.
- Dullinger et al. (2013). Europe’s other debt crisis caused by the long legacy of future extinctions. Proceedings of the Natural Academy of Sciences 110:18, 7342-7347.
Fra pollen til klima
Fra tid til annen hører man forskere fortelle om hvordan vegetasjon og klima har vært i tidligere tider, men det blir ikke alltid forklart hvordan man kommer frem til dette. Flere fagdisipliner (zoologi, meteorologi, oseanografi, geologi m.fl.) er som regel involvert og ofte er botanikk en av vitenskapene som ligger til grunn.
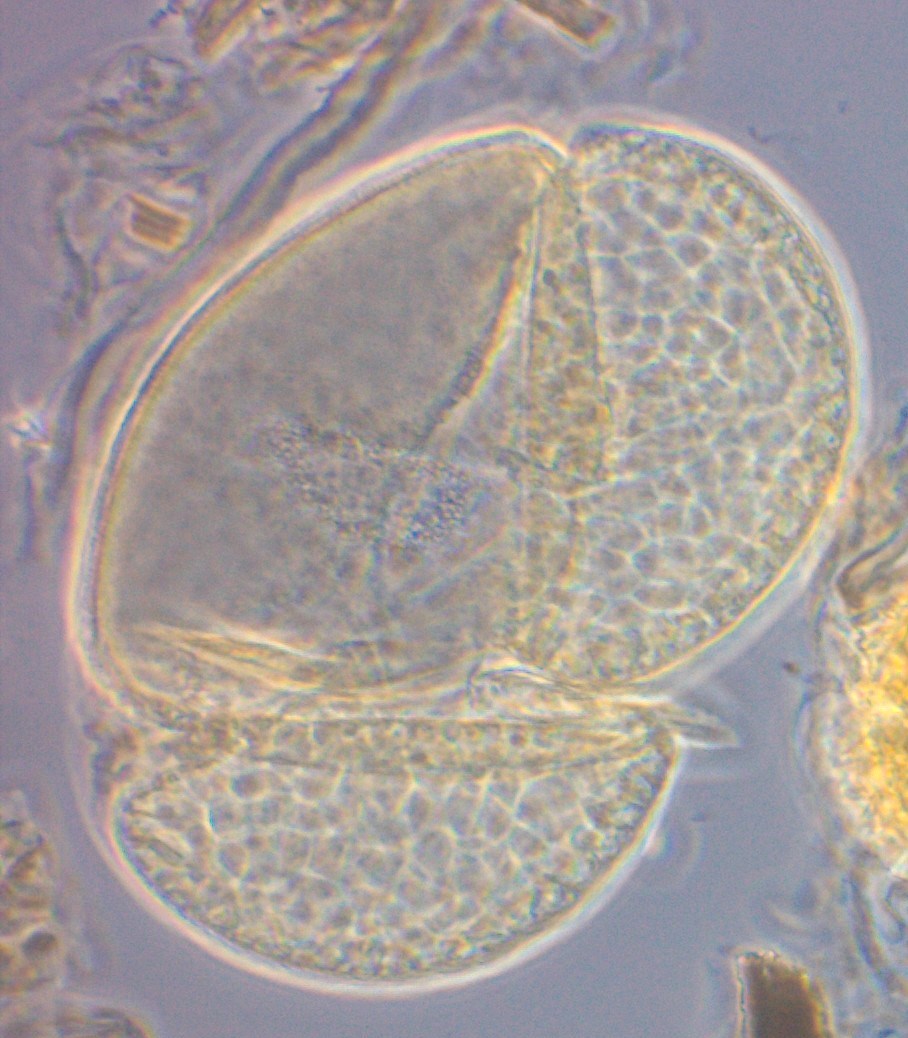
Når man hører ordet botanikk tenker man kanskje på det man ser rundt seg i skog, eng og hage, men at man med utgangspunkt i botanikk kan finne ut hva som vokste i et område og hva slags klimatiske forhold det var der for flere tusen år siden ved hjelp av innholdet i en myr eller en innsjø er kanskje ikke noe man reflekterer over til daglig. Denne delen av botanikken kalles vegetasjonshistorie og en mye brukt metode for å belyse vegetasjonshistorien til et område er pollenanalyse, en metode som har vært benyttet siden Lennart von Posts første resultater fra myrer i Sverige tidlig på 1900-tallet [1, 2]. Siden den gang har man fått bedre mikroskop og et stort utvalg av manualer for pollenidentifikasjon [3, 4 m.fl.] men grunnprinsippene for pollenanalyse som metode er fortsatt de samme; at man ved å se på polleninnholdet i en jordprøve av gitt alder kan få et bilde på vegetasjonen på det tidspunktet.
Planter produserer ofte store mengder pollen og bare en liten fraksjon av dette tar del i befruktningen av hunnplanter/-blomster. Overskuddet ender opp sammen med annet organisk og uorganisk materiale i avsetninger på land eller i vann. Over tid bygges disse avsetningene opp og selv når mesteparten av annet organisk materiale er brutt ned så vil pollen holde seg omtrent uforandret så lenge avsetningsforholdene er oksygenfri (som i en myr eller i en innsjø). Dette fordi veggen i pollenkorn inneholder kjemiske forbindelser (kalt sporopolleniner) som gjør pollen veldig hardføre mot nedbrytning. Disse forbindelsene oksideres (ødelegges) derimot lett i luft så pollen vil brytes relativt raskt ned i avsetninger som ikke har lite oksygen [3, 5].
Det er flere antagelser som ligger i bunnen for pollenanalyse som metode; en av disse er at man forutsetter at pollen fra en gitt plante ikke har endret utforming over tid, dvs. at et pollen fra en furu som blomstrer i år ser likens ut som et fossilt furupollen som er flere tusen år gammelt. En annen ting er at man antar at plantene hadde de samme kravene til levevilkår (temperatur, fuktighet, jordsmonn osv.) i fortiden som de har i dag [3].
 |
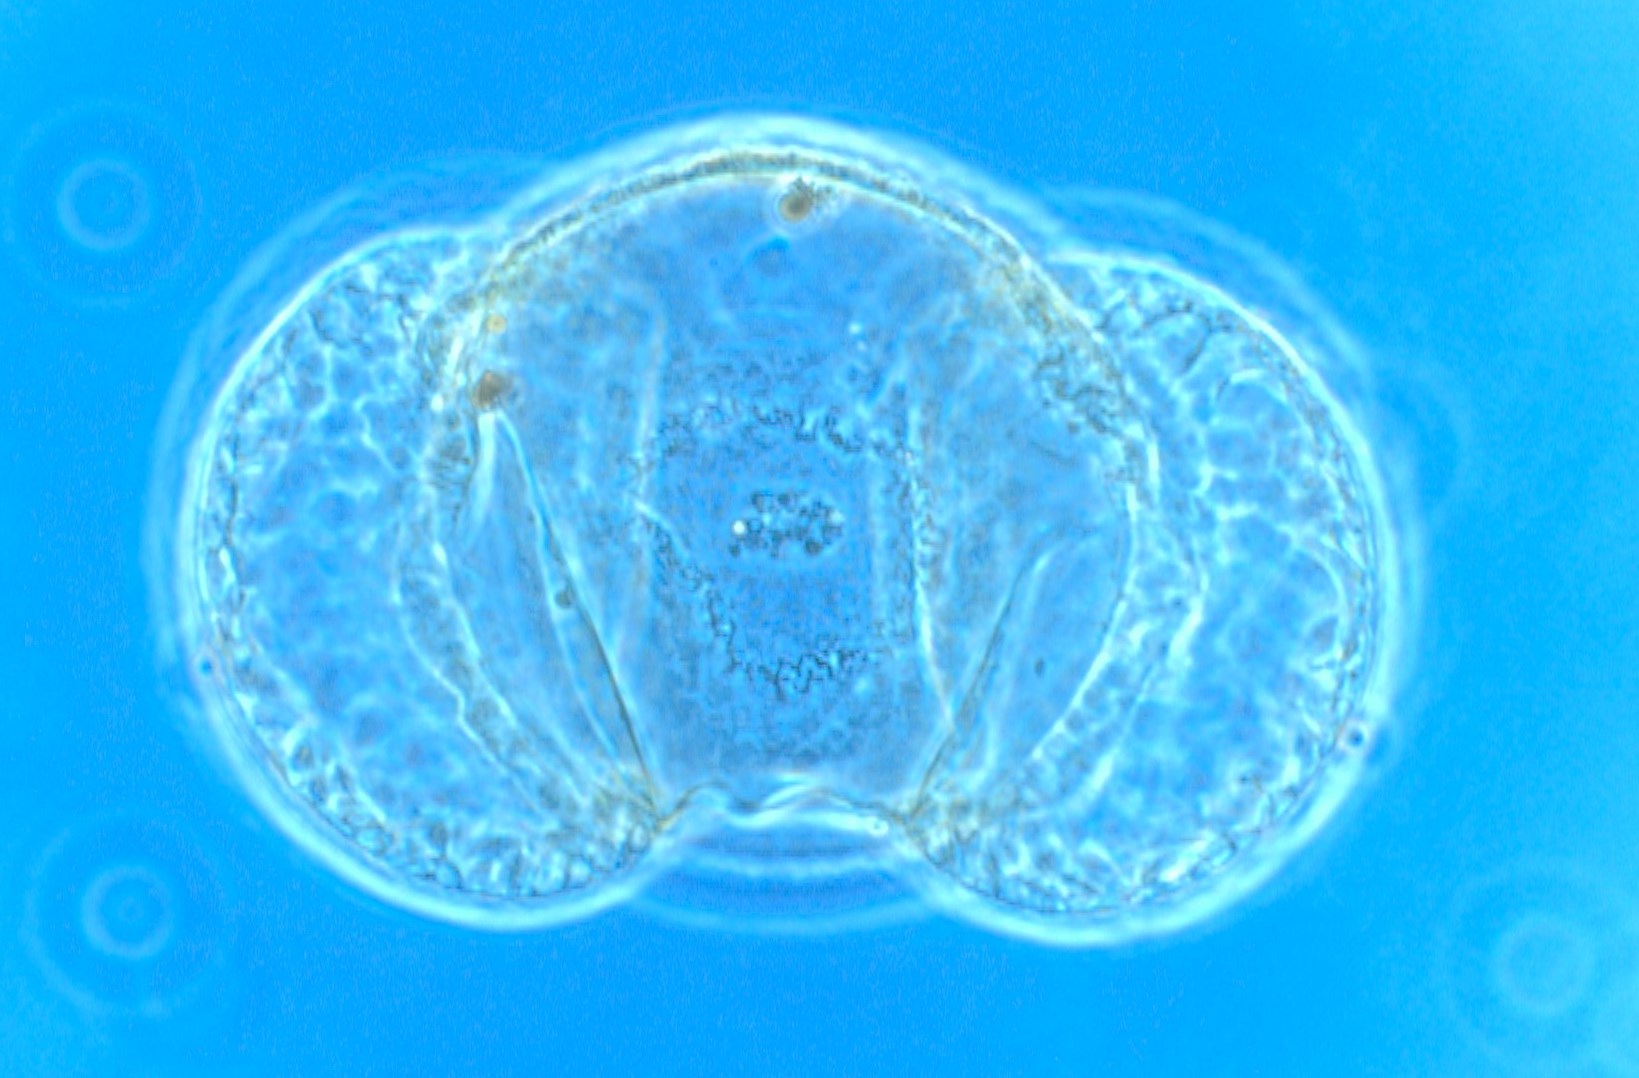 |
| Figur 1. Mikroskopbilder av pollenkorn fra furu. Pollenkornet til venstre er 4000 år gammelt, det til høyre er 30 år gammelt. | |
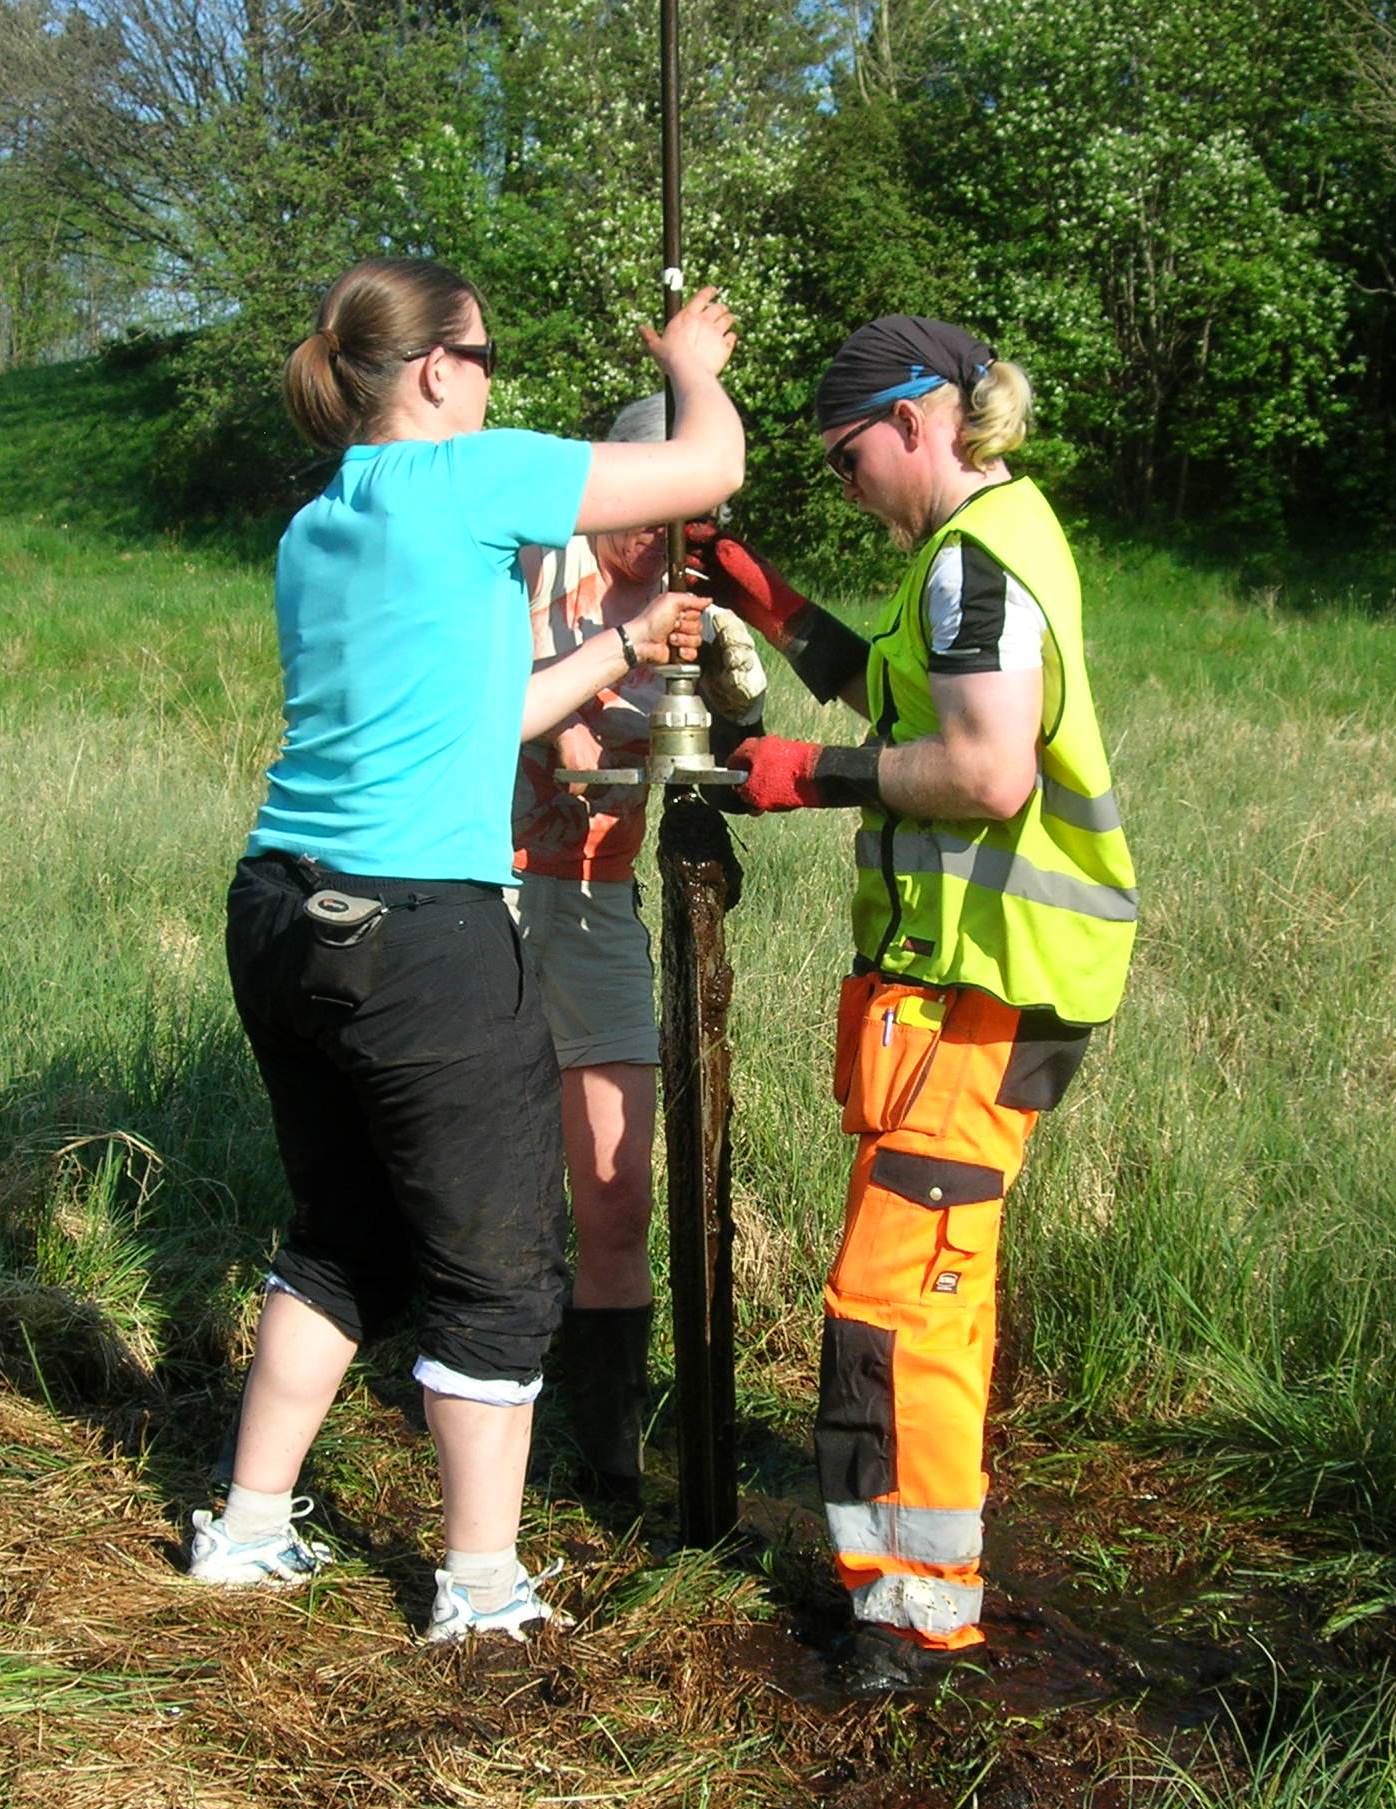
I en vegetasjonshistorisk undersøkelse vil man ta opp en sedimentkjerne fra et vann eller en myr og så ta ut små jordprøver nedover i sekvensen fra denne kjernen, fra øverst til nederst.
 |
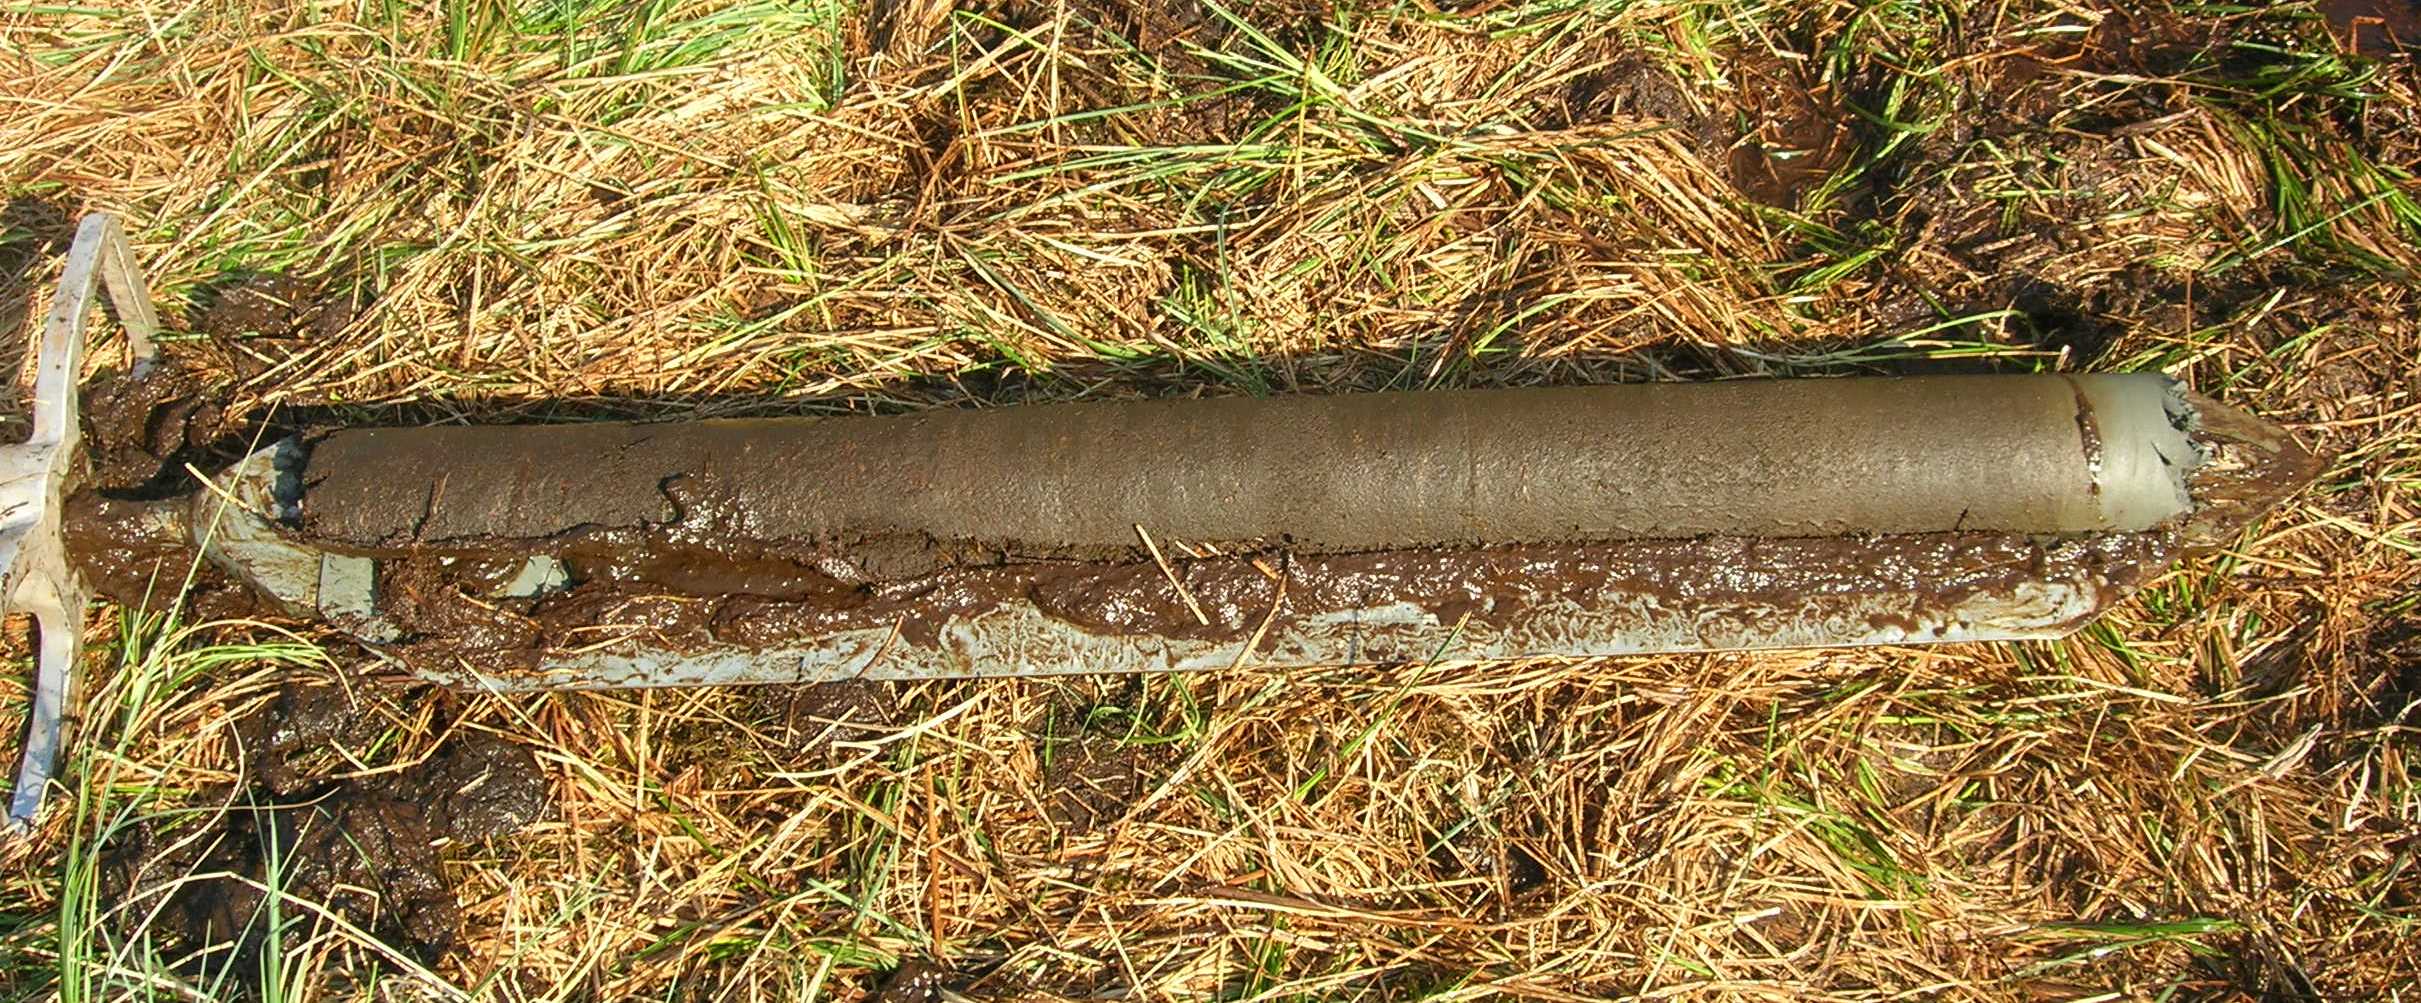 |
| Figur 2. Til venstre vises prøvetaking med russerbor (en type sedimentkjerneopptaker). Foto: L.I. Åstveit. Til høyre vises en sedimentkjerne der man til høyre ser den grå bunnavsetningen. Bunnen av det brune laget er datert til 9 100 f.Kr. Foto: L.S. Halvorsen | |
Fra hver av jordprøvene lager man til en mikroskopprøve der man ser på polleninnholdet (hvilke pollentyper som finnes og antallet av dem) og resultatet gis i en figur (et pollendiagram) som viser prosentfordelingen av de ulike pollentypene i hver prøve langs en dybdeakse (som også er en relativ tidsakse, eldste prøve nederst). Fra dette diagrammet kan man lese av hvor mye det har vært av hver pollentype ved en gitt dybde, og fra dette kan man få et bilde på vegetasjonen. F.eks. kan man ha 20 % bjørk, 5 % furu, 60 % gress og til sammen 15 % av diverse urter som tilsier at man har hatt en åpen vegetasjonstype f.eks. en eng med noen trær rundt.
 |
|
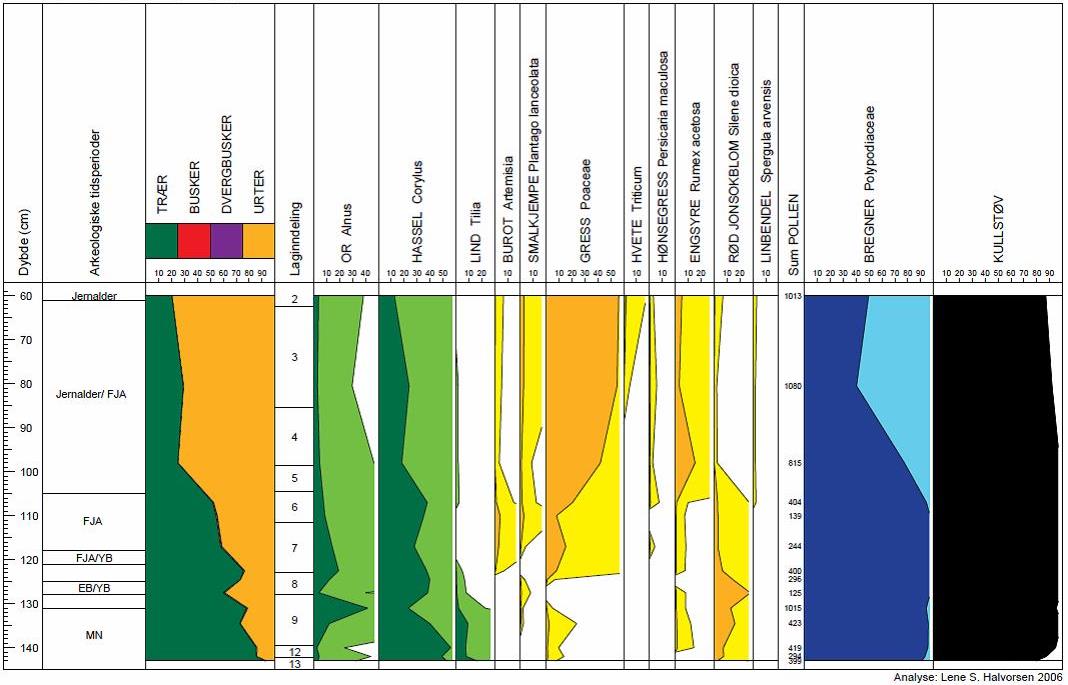
| Figur 3. Pollenprosentdiagram. Første kurve etter dybdeskalaen viser forholdet mellom trær, busker, dvergbusker og urter i pollenprøvene. I kurvene for hver pollentype viser den mørke fargen prosentverdi, den lysere fargen denne verdien x 10. Figur: L.S. Halvorsen. | |
Det er også viktig å vite alderen på prøvene i en slik pollensekvens. Alderen på en prøve kan man finne ved å datere på organisk materiale (frø, planterester, trekull o.l.) funnet i sedimentkjernen ved hjelp av C-14 metoden [6,7]. Man vil ofte datere der man ser tydelige endringer i pollendiagrammet f.eks. der man har en kraftig reduksjon i treslagspollen, første forekomst av kornpollen eller lignende. Når man har dateringer så får man både et bilde på hvordan vegetasjonen har sett ut i tillegg til informasjon om når det var den så slik ut.
Fra vegetasjonssammensetningen kan man gjøre antagelser i forhold til klimatiske forhold. Dette fordi man antar at økologien til plantene man ser spor etter ikke har endret seg over tid, og man bruker det man vet om plantenes klimatiske voksekrav i nåtiden for å si noe om klima i forhistorien [3,8] og ved å sammenstille resultater av pollenanalyser fra sedimentkjerner fra flere lokaliteter kan man få et bilde på vegetasjonsutviklingen for et større landområde eksempelvis vestkysten av Norge, nordlige Skandinavia e.l. og derved kunne si noe om klimatiske forhold i det området.
For å bedre kunne si noe om klima ved slike sammenstillinger av data har man laget til datasett der man har undersøkt polleninnholdet i overflateprøver (moderne prøver) fra mange innsjøer i forskjellige klimatiske vegetasjonssoner og koblet informasjonen fra disse med temperatur og nedbørsmålinger fra klimastasjoner i nærheten av innsjøene. På den måten får man et datasett som kobler pollendata med de klimatiske faktorene for stedet [9, 10]. Dette datasettet kan så brukes som sammenligningsgrunnlag for fossile pollensekvenser og man kan få ut en temperatur eller nedbørskurve for den fossile sekvensen på bakgrunn av det man har funnet fra det moderne datasettet [9, 10, 11]. Informasjonen fra disse kurvene kan sammen med pollendataene si noe om hvordan vegetasjonen har endret seg med klima, og dette kan så relateres til klimaendringer man ser i nåtiden [12] som en pekepinn på hvordan vegetasjon kan komme til å endre seg.
 |
|
| Figur 4. Dette er Figur 7 fra Bjune et al. 2010 [9]. Viser rekonstruert julitemperatur og årsnedbør basert på pollendata fra Kråkenes. Brutt linje=stort (321 innsjøer) kalibrasjonsdatasett; hel linje=lite (191 innsjøer) kalibrasjonsdatasett. | |
Noen av antagelsene ved en slik analyse er at man har dekket alle mulige kombinasjoner av klimadata og pollensammensetning, og at det i fortiden ikke har vært andre kombinasjoner. Det blir heller ikke tatt høyde for menneskelig påvirkning i det moderne datasettet da overflateprøvene (i kalibrasjonsdatasettet) stort sett er tatt fra innsjøer der man antar man har hatt lite eller ingen menneskelig påvirkning [9]. Mennesket har påvirket naturen i større og mindre grad spesielt siden overgangen fra jakt/fiske/samlersamfunn til jordbrukssamfunn og å inkludere informasjon fra steder der man har spor etter menneskelig påvirkning i modellene har potensiale for å gi bedre modeller for fortidens vegetasjon- og klimahistorie [13, 14].
Veien fra grunndata til klimarekonstruksjon er en lang prosess som involverer mange ulike steg. Det er viktig at man i dagens situasjon ikke glemmer at man for å styrke klimaforskingen for å få så bra modeller for fremtidige klimascenarier som mulig må huske at grunnforskingen må støttes så modellene blir så gode som mulig.
Av Lene S. Halvorsen
Referanser:
[1] von Post, L. (1916) Om skogsträdpollen i sydsvenska torfmosselagerföljder. Geologiska Föreningens i Stockholm Förhandlingar 38: 384–390
[2] von Post, L. (1918) Skogsträdpollen i sydsvenska torvmosselagerföljder. Förh. Skand. Naturforskeres 16. møte 1916. pp. 432–465
[3] Fægri, K. and Iversen, J. (1989) Textbook of pollen analysis. 4.ed. By: Fægri, K., Kaland, P.E. & Krzywinski, K. John Wiley & Sons, 328 pp.
[4] Moore, P. D., Webb, J. A. and Collinson, M. E. (1991) Pollen Analysis. 2.ed.
Oxford: Blackwell Scientific Publications, 216 pp.
[5] Sporopolleniner. Definisjon fra Store Norske Leksikon. https://snl.no/sporopolleniner
[6] Arnold, J.R. and Libby, W. F. (1949) Age Determinations by Radiocarbon Content: Checks with Samples of Known Age. Science 110: 678-680. [DOI:10.1126/science.110.2869.678]. Tilgjengelig via: http://hbar.phys.msu.ru/gorm/fomenko/libby.htm
[7] Radiocarbon: an introduction. http://www.radiocarbon.com/about-carbon-dating.htm
[8] Birks, H. J. B., Birks, H. H. (1980) Quaternary Palaeoecology, E. Arnold, London.
[9] Bjune, A. E., Birks, H. J. B., Peglar, S. M. & Odland, A. (2010) Developing a modern pollen–climate calibration data set for Norway. Boreas 39: 674-688
[10] Cheddadi, R., de Beaulieu, J.-L., Jouzel, J., Andrieu-Ponel, V, Laurent, J.-M., Reille, M., Raynaud, D., Bar-Hen, A. (2005) Similarity of vegetation dynamics during interglacial periods. PNAS 102 (39): 13939-13943
[11] Bjune, A.E., Seppä, H., Birks, H.J.B. (2009) Quantitative summer-temperature reconstructions for the last 2000 years based on pollen-stratigraphical data from northern Fennoscandia. Journal of Palaeolimnology 41: 43-56
[12] IPCC 2014. IPCC: Summary for Policymakers. Contribution of Working Group III to the Fifth Assessment Report of the Intergovernmental Panel on Climate Change. In: Edenhofer, O., Pichs-Madruga, R., Y. Sokona, E. F., S. Kadner, K. S., A. Adler, I. B., Brunner, S., Eickemeier, P., Kriemann, B., Savolainen, J., Schlömer, S., Stechow, C. V., Zwickel, T. & Minx, J. C. (eds.) Climate Change 2014: Mitigation of Climate Change. Cambridge University Press, Cambridge, United Kingdom and New York, NY, USA
[13] Paus, Aa (2013) Human impact, soil erosion, and vegetation response lags to climate change: challenges for the mid-Scandinavian pollen-based transfer function temperature reconstructions. Vegetation History and Archaeobotany 22: 269-284
[14] Trondman, A.-K., Gaillard, M.-J., Mazier, F., Sugita, S., Fyfe, R., Nielsen, A.B, Twiddle, C., Barratt, P., Birks, H.J.B., Bjune, A.E., Björkman, L., Broström, A., Caseldine, C., David, R., Dodson, J., Dörfler, W., Fischer, E., van Geel, B., Giesecke, T., Hultberg, T., Kalnina, L., Kangur, M., van der Knaap, P., Koff, T., Kuneš, P., Lagerås, P., Latałowa, M., Lechterbeck, J., Leroyer, C., Leydet, M., Lindbladh, M., Marquer, L., Mitchell, F.J.G, Odgaard, B.V., Peglar, S., Persson, T., Poska, A., Rösch, M., Seppä, H., Veski, S., Wick, L. (2015) Pollen-based quantitative reconstructions of Holocene regional vegetation cover (plant-functional types and land-cover types) in Europe suitable for climate modelling. Global Change Biology 21: 676-697
Når natten ikke lenger er mørk
Hva er det som forteller fuglene når de skal trekke sørover, blomstrene når de skal blomstre og fisken når den skal jakte? Mange funksjoner i naturen er styrt helt eller delvis av variasjoner i lys fra dag til natt, og fra sommer til vinter. Mange dyre- og plantearter har tilpasset seg de forutsigbare lysmønsterene og regulerer metabolisme, vekst og atferd etter lysvariasjonene [1].
Hva skjer så når disse mønsterene blir brutt av kunstig belysning i byer, langs veier eller på oljeplattformer? En mye brukt definisjon av lysforurensing er at kunstig lys med intensitet større enn lyset fra månen i den første fjerdedelen av en månefase regnes som lysforurensing (se f.eks. [2] og [3]). Allerede for 14 år siden anslo man at 62% av den befolkede verden var over dette nivået [2], og 25% av den befolkede verden hadde lysforurensing som var sterkere enn lyset fra fullmånen [3].
Flere forskere anslår at kunstig belysing har enorme påvirkniger på dyre- og planteliv, men det finnes likevel få studier som har undersøkt dette [4]. Et unntak er påvirkningen kunstig lys har på fugler sin atferd hvor det finnes relativt mange studier. Flere av påvirkningene slikt lys har på fugler har du kanskje observert selv, uten å vere klar over det.
Nattaktive rødstruper
Rødstrupen er en av våre vanligste spurvefugler og en ivrig sangfugl med en lett gjenkjennelig sang. Gjennom det meste av året kan du høre fuglen synge om dagen, både i skog og mark og i byer. Etter hvert har det også blitt vanligere å høre rødstrupens sang gjennom natten i bynære områder. Forskere har undret seg over denne atferden og kommet fram til at kunstig lys er en viktig faktor [5]. Det kunstige lyset kan oppfattes som dagslys, og for en urban rødstrupe kan det virke som om dagen aldri tar slutt. For en sen nattevandrer på vei hjem fra byen kan det kanskje være fint å høre rødstrupen synge i mørket, men for rødstrupen selv kan situasjonen være svært alvorlig. Fuglen bruker nemlig så mye av sin tid og sine krefter på å synge at den glemmer andre viktige gjøremål, som å spise og sove [6].
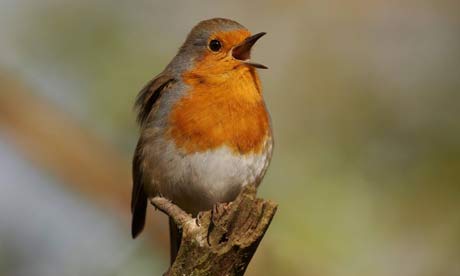
Rødstrupen er en ivrig sanger om dagen. Når kunstig lys holder den våken om nettene risikerer den blant annet vekttap og søvnmangel [6]. Foto: Neil Hardwick/Alamy [7]
Lysende oljeplattformer
Det er ikke bare i byer at det fnnes lyskilder som lyser hele døgnet. Oljeplattformene i Nordsjøen står som lysende øyer i ett ellers bleksvart hav. Mange marine fugler trekker over Nordsjøen og lyset fra oljeplattformene tiltrekker seg disse. Hvorfor fuglene blir tiltrukket av dette lyset er noe usikkert [8], men trolig kan de fleste tilfellene forklarest av at lys er viktig for navigasjonen til fuglene, samt at noen fugler tror at lyset kan bety mat [9]. Noen av fuglene kolliderer med selve plattformen, mens de fleste ender opp med å bruke store ressurser på å sverme rundt lyskilden [4].
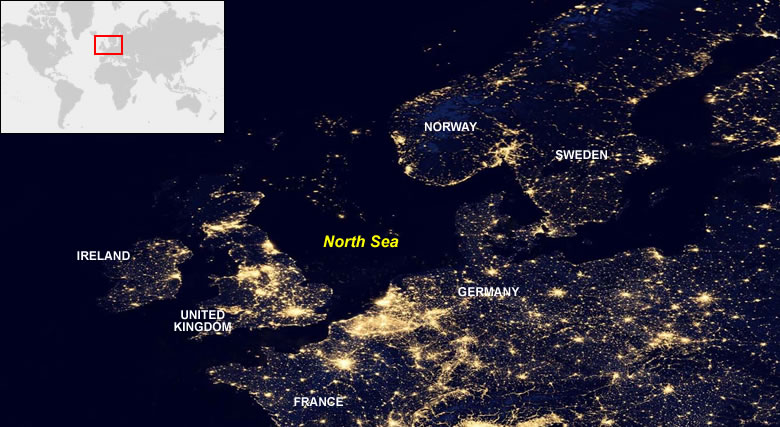
Oljefeltene i Nordsjøen er svært tydelig i mørket. Foto: NASA [10]
Mulig positiv effekt
Til tross for enda flere eksempler på hvordan fugler blir forvirret av kunstig lys finnes det også eksempler som antyder at kunstig belysing kan vere positivt for enkelte arter.
Vadefugler lever av smådyr som de finner i mudderet og er normalt bare aktive på dagtid. I strandområder som er kunstig opplyst, for eksempel av en nærliggende vei, kan vaderene utnytte det kunstige lyset til å lete etter mat, og noen studier anslår at næringsinntaket i slike områder er opp til 80% høyere enn i områder som kun har naturlig dagslys [11]. Norsk Institutt for Naturforsking (NINA) advarer likevel mot å tolke disse studiene til å vere utelukkende positive for vaderene, da de ikke omfatter potensielle risikofaktorer ved det endrede atferdsmønsteret, som for eksempel påkjøring i trafikken og økt utsettelse for predatorer [4].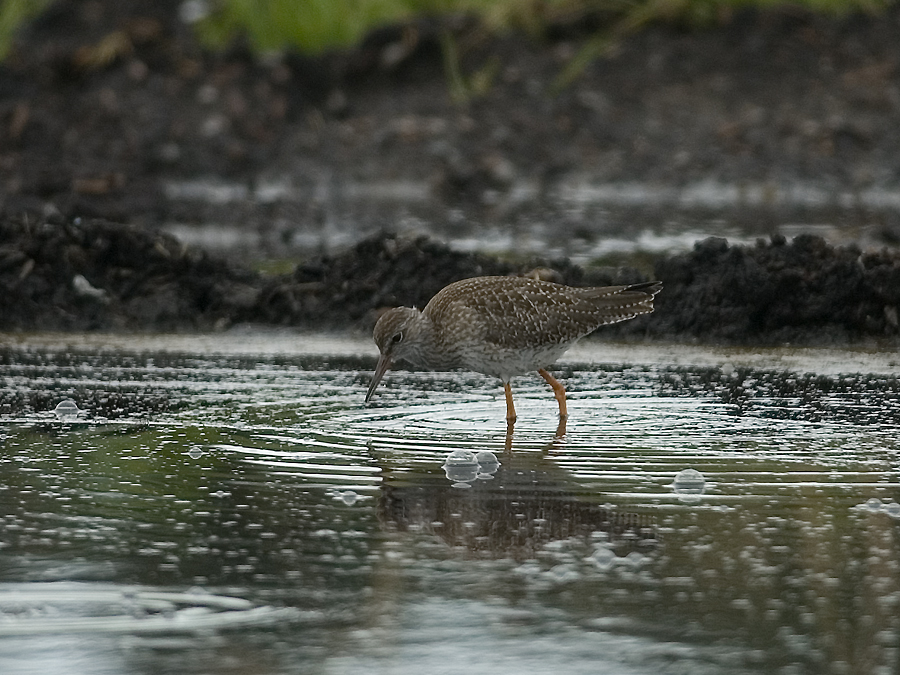
Rødstilken er en vadefugl som kan dra nytte av kunstig belysing under matsøk. Foto: Arild Breistøl
Finnes det en løsning?
Selv om de fleste studier peker mot at kunstig belysing er en negativ effekt for naturmangfoldet, er det vanskelig å forestille seg et samfunn uten opplyste veier, gater og bygninger. Kunstig lys blir også brukt til kommunikasjon, for eksempel i lufttrafikken. Det finnes likevel håp. Flere studier har sett på effekten av å endre sammensettingen i lyskildene, og resultatene er lovende [se f.eks. 4 og 8]. For eksempel har man testet ut bruken av grønt lys på oljeplattformer i Nordsjøen, og resultatet viste at antallet fugl som ble tiltrukket av plattformene ble dramatisk redusert [8]. Det er også mulig å redusere intensiteten på lyset slik at det lyser opp et mindre område, og skjerme eller vinkle lysstrålen slik at den lyser opp det området den er tiltenkt og ikke området rundt i tillegg [4].
REFERANSER
[1] Hölker, F., Wolter, C., Perkin, E. K. og Tockner, K., 2010. Light pollution as a biodiversity threat. Trends in Ecology & Evolution , Volume 25 , Issue 12 , 681 – 682
[2] Cinzano, P., Falchi, F., Elvidge, C.D., 2001. The first World Atlas of the artificial night sky brightness. – Mon. Not. R. Astron. Soc. 328: 689-707.
[3] Raven J.A. and Cockell, C. S., 2006. Influence on Photosynthesis of Starlight, Moonlight, Planetlight, and Light Pollution (Reflections on Photosynthetically Active Radiation in the Universe). Astrobiology. 6(4): 668-675. doi:10.1089/ast.2006.6.668.
[4] Follestad, A., 2014. Effekter av kunstig nattbelysning på naturmangfoldet – en litteraturstudie. – NINA Rapport 1081
[5] Kempenaers, B., Borgström, P., Loës, P., Schlicht, E. and Valcu, M., 2010. Artificial Night Lighting Affects Dawn Song, Extra-Pair Siring Success, and Lay Date in Songbirds. Current Biology. Volume 20, Issue 19, 12, Pages 1735–1739
[6] David Dominone, 2015. Upublisert. Hentet fra AAAS’s årlige møte 11.-16. februar 2015.
[7] Bilde hentet fra http://www.theguardian.com/culture/tvandradioblog/2008/feb/07/cheepandcheerfulthenewrad (20.02.15)
[8] Poot, H., Ens B. J., de Vries, H., Donners, M. A. H., Wernand, M. R., and Marquenie, J. M., 2008. Green light for nocturnally migrating birds. Ecology and Society 13(2): 47.
[9] Wiese, F.K., Montevecchi, V.A., Davoren G. K., Huettmann, F., Diamond, A. W. and Linke, J., 2001. Seabirds at Risk around Offshore Oil Platforms in the North-west Atlantic. Marine Pollution Bulletin. Volume 42, Issue 12, Pages 1285–1290
[10] Bilde hente fra http://geology.com/articles/oil-fields-from-space/ (20.02.15)
[11] Santos, C.D., Miranda, A.C., Granadeiro, J.P, Lourenço, P.M., Saraiva, S. & Palmeirim, J.M., 2010. Effects of artificial illumination on the nocturnal foraging of waders. – Acta Oecologica 36:166-