About rgy042
View all posts by rgy042
The sixth mass extinction
By: Ragnhild Gya
Whether we are going into the sixth mass extinction or not has been heavily debated. In 2015 a paper was published by Gerardo Ceballos and his colleagues were they state that the sixth mass extinction is happening, and that we are causing it. I am now going to try and explain their arguments the best I can, you can also read the article yourself (reference in the end of this blog entry).
Extinctions happen all the time. Did you know that over 90 % (and maybe closer to 98%) of all species that has lived on Earth is now extinct? Whether we have a net gain or a net loss of biodiversity and species depends on the rate of occurring new species and the rate of extinctions. This “normal” amount of species going extinct is called the background rate of extinctions. This background rate stands for most of the extinctions in the history of the earth; actually the mass extinctions can only be blamed for 4 % of all extinctions in the last 600 million years.
When the extinction rate is much higher than the background rate, it is classified as a mass extinction. The most famous one is the one that killed the dinosaurs, 65 million years ago, which is called the Cretaceous-Paleogene extinction event. The one that killed the most species is the Permian-Triassic extinction event, which made 95 % of marine species and 70 % of species on land go extinct. Are we also now in a period similar to these two?
To figure this out scientist estimate the normal background rate of extinctions from fossil records, written observations etc. and compare that to a number that they have calculated for our current extinction rate. A lot of scientists have published papers where they conclude that we are in a mass extinction because of the results of these calculations. Ceballos and his colleagues discussed the fact that the background rates were calculated from marine invertebrates and that the background rate would probably be higher if we considered other groups as well. So instead of using the most used background rates which are between 0.1 and 1 extinction per 10 000 species per 100 years (0.1-1 E/MSY), they used 2 E/MSY. They more than doubled the previous number for the background rate, which should make it harder to get a result that says that we are in the sixth mass extinction if we actually are not.
To find the modern extinction rate, the used the IUCNs (International Union of Conservation of Nature) list over threatened and extinct species. They have three “extinct” categories: “extinct” (EX), “extinct in the wild” (EW) and “possibly extinct” (PE). They calculated using two different approaches: the highly conservative one with only using numbers from the category extinct, and the conservative one using all three categories.
You can see the results of these calculations in the table underneath. The numbers are how much higher the current extinction rate is compared to the background rate. As you can see, it varies from 8 to 100, and this is using the conservative method to calculate it. As a conclusion we are now no longer in doubt about this period – it is the sixth mass extinction.
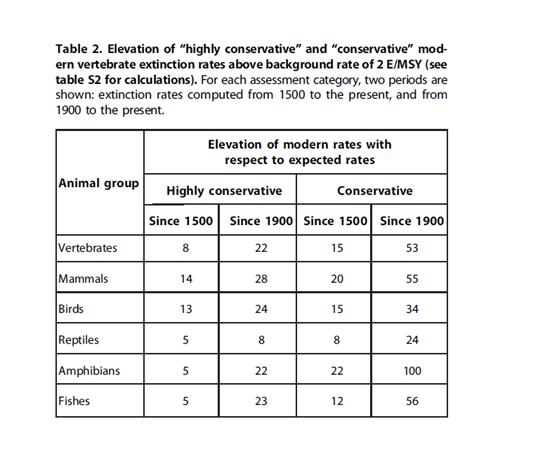
Table: Ceballos et al. (2015)
Just to remind you what we are losing, here are some species that have gone extinct in the past 100 years:
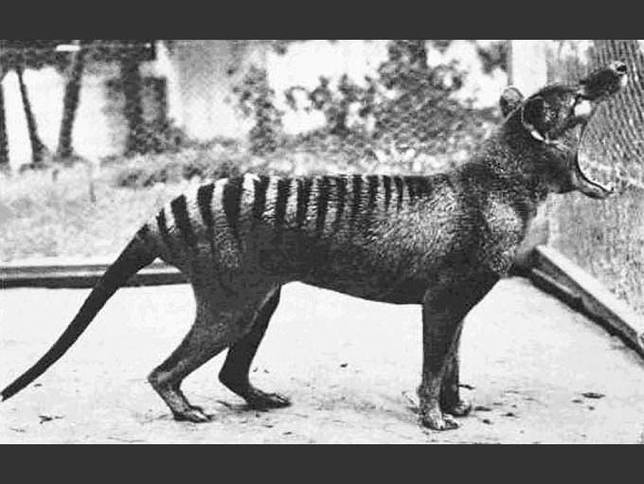
Extinction 1: The last Thylacine in captivity, pictured above, died in 1936.
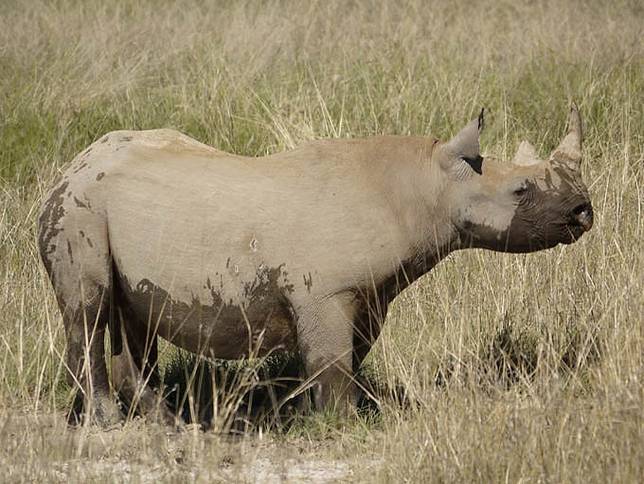
Extinction 2: Wester Black Rhino. Once widespread in central west Africa, in 2011 it was declared extinct.
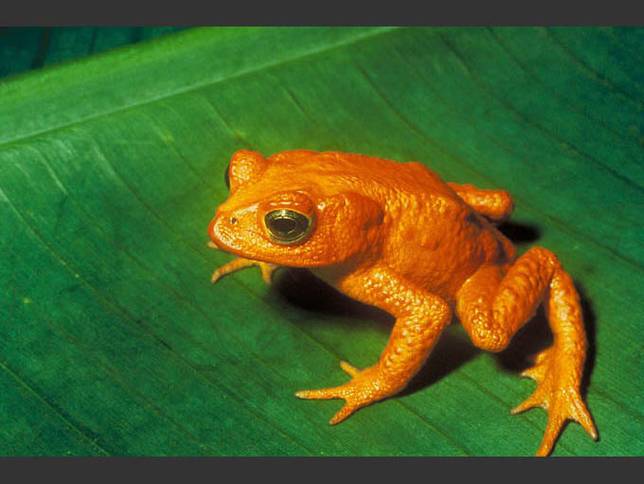
Extinction 3: Golden Toad. Only described to science in 1966, and once abundant in a 30 square mile area of the cloud forest above Monteverde, Costa Rica, none of the toads have been sighted since the 15th of May 1989
References
Kevin J. Gaston and John I. Spicer (2004). Biodiversity – an introduction. 2nd ed. : Blackwell Publishing. p19-48.
Gerardo Ceballos, P. R. Ehrlichm A. D. Barnosky, A. García, R. M. Pringle, T. M. Palmer. (2015). Accelerated modern human-induced species losses: Entering the sixth mass extinction. Science. 1 (5), .
https://en.wikipedia.org/wiki/Extinction_event (24/02/2016)
Pictures:
http://www.treehugger.com/slideshows/natural-sciences/glimpse-what-we-lost-10-extinct-animals-photos/ (24/02/2016)
https://www.flickr.com/photos/martijnmunneke/6521931525/sizes/l/in/photostream/ (24/02/2016)
https://en.wikipedia.org/wiki/File:Bufo_periglenes2.jpg (24/02/2016)
Food for a growing population of humans
Today we have a large population of people who are starving or suffering from malnutrition. According to the food assistance branch of the UN, the World Food Program, 45% of deaths in children under the age of five is caused by poor nutrition. They also state that in the sub-Saharan Africa, which is the region with the highest prevalence of hunger, one in four people are undernourished
As we can see getting enough food for our large human population is already a problem – and it is only going to get worse. The human population is predicted to keep growing up to 9 billion (Godfray et al. 2010).
To understand some of the problems with choosing types of food for a larger human population we need to know a little bit about different trophic levels, which ScienceDaily defines as:
“In ecology, the trophic level is the position that an organism occupies in a food chain – what it eats, and what eats it.”ScienceDaily 11/02/16
In each trophic level the organism is using most of the energy for everyday processes, and that energy is ultimately lost for the ecosystem as respiratory heat. The energy that is not lost is used to build new biomass, which is called the production efficiency. Across all species the average production efficiency is 10 %, which means that the remaining 90 % is lost between each trophic level. These numbers differ between types of organism and especially with what kind of metabolism the organism has. The production efficiency can be anything from 1% to 50%.
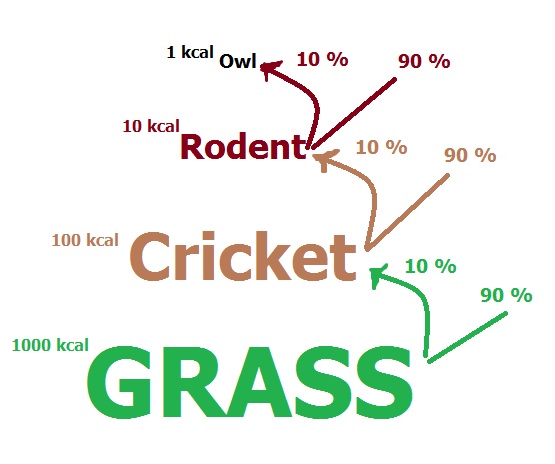
Let’s look at one example. 10 % of the energy that the grasses produce during a lifetime is possible to transfer to the next trophic level: a cricket. The growth of the cricket biomass, which is only 10 % of the energy it got from the grass, will be the source of energy for a rodent. 10 % of that energy again will be accumulated in the biomass of the rodent, which the owl will be eating. So if you start out with 1000 kcal of grass, the owl at the top will only end up with 1 kcal of this.
This helps us to understand that if we use a lower trophic level as a source for food, we can get more food for more people and less energy is lost in the food chain.
By simulating the scenario that we eat less meat Stehfest et al. (2009) have found that we could reduce the amount of pasture area with 80 % compared to our dietary habits of today. This means that we could produce more food for more people, but decrease our use of land for food production. Stehfest et al. (2009) also points out that this could have a positive effect on the climate because these former crop-landscapes would capture carbon from the atmosphere as the vegetation grow back.
It looks like one of the ways that we can solve the problem of finding enough food for a growing human population is to reduce our consumption of meat. Are we willing to do that?
Written by: Ragnhild Gya
Sources:
Begon M., R.W. Howarth, C. R. Twonsend. (2014). The flux of energy and matter through
ecosystems. In: Essentials of Ecology. United States of America: Wiley. p 309-340.
Godfray H.C.J., J. R. Beddington, I.R. Crute, L. Haddad, D. Lawrence, J.F. Muir, J. Pretty, S.
Robinson, S. M. Thomas, C. Toulmin (2010) “Food: Security: The Challenge of
Feeding 9 Billion People”. Science. 327: 812-818
ScienceDaily. (2015). Trophic level. Available:
http://www.sciencedaily.com/terms/trophic_level.htm. Last accessed 11/02/16.
Stehfest E., L. Bouwman, D.P. van Vurren, M.G.J. den Elzen, B. Eickhout, P.Kabat (2009)
“Climate benefits of changing diet”. Climatic Change. 95:83-102
World Food Program. (2016). Hunger Statistics. Available: https://www.wfp.org/hunger/stats.
Last accessed 11/02/16.